Figures & data
Figure 1. The effect of silicon and salinity on the growth of date palm seedlings (a). Growth changes in date palm seedlings grown under silicon (Si), control, silicon and saline (NaCl+Si) and saline (NaCl) conditions. These changes in the leaf area (b), leaf fresh weight (c) and root dry weight (d) of date palm seedlings subjected to silicon, salinity, and silicon combined with salinity treatments. The bars represent the means (n = 9 ± SE) and significant differences at p < .05 are marked by asterisks.
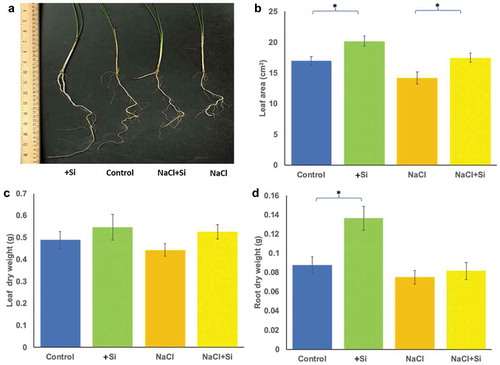
Figure 2. Changes in photosynthesis-associated parameters due to salinity and silicon treatments. The parameters include the net photosynthesis (A) (a), internal leaf CO2 concentration (ci) (b), stomatal conductance (gs) (c) and transpiration (E) (d). The values represent the means (n = 9 ± SE) and significant differences at p < .05, p < .01, p < .001 are marked by asterisks as (*), (**), and (***), respectively.
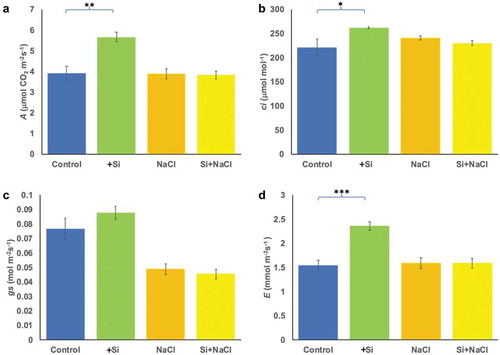
Figure 3. Changes in Na+ and K+ concentrations in response to salt stress and silicon treatments in leaves (a) and roots (b). The values represent the means (n = 9 ± SE) and significant differences at p < .05, and p < .001 are marked by asterisks as (*), and (***), respectively.
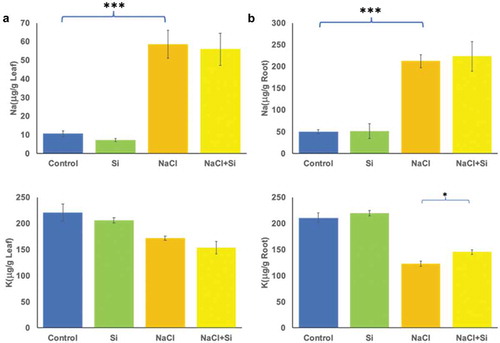
Figure 4. The changes in the width of the Casparian strip observed under the fluorescent microscope in roots of plants grown under different treatments. The stained root images were taken from control plants (a), salinity-treated plants (b) and silicon alone treated plants (c), and salt stress plus silicon-treated plants (d). The measurements were statistically analyzed for different samples (e). Changes in the width were measured in μm. The values represent the means (n = 15 ± SE) and significant differences at p < .001 are marked by asterisks.
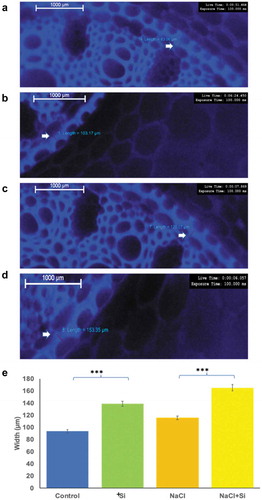
Figure 5. Principal component analysis (PCA) illustrating distances between metabolites identified from a group of three replicate samples of leaves (CL) and roots (CR) when the plants were irrigated with distilled water, leaves (NL) and roots (NR) when the plants were irrigated with 300 mM NaCl solution, leaves (SiL) and roots (SiR) when the plants were irrigated with a silicon solution only and leaves (NSiL) and roots (NSiR) when the plants were irrigated with a salt solution in the presence of silicon. The first two coordinates explained about 64% of the variance.
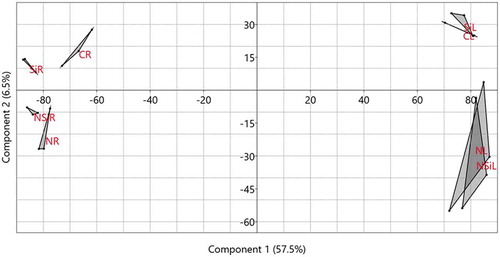
Figure 6. The distribution of a number of metabolites identified from leaves (a) and roots (b) of the plants grown under control, salinity, silicon or salinity combined with silicon treatment. The number of metabolites produced in leaves (CL) or roots (CR) of control plants, leaves (NL) or roots (NR) of plants treated with salinity, leaves (SiL) or roots (SiR) of plants treated with silicon alone or leaves (NSiL) or roots (NSiR) of plants treated with silicon and salinity, are illustrated in the Venn diagram.
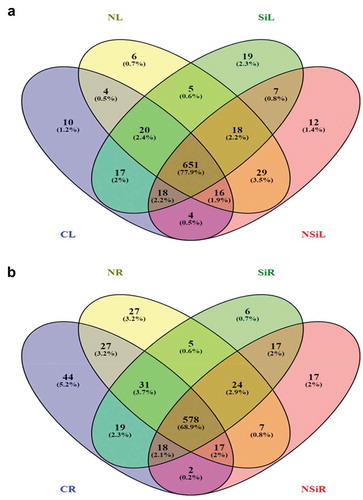
Figure 7. Heat map depicting the differential accumulation of selected metabolites and their classification in the leaves or roots of plants grown under control, salinity, silicon or salinity combined with silicon treatment. The heat map in leaves (CL) or roots (CR) of control plants, leaves (NL) or roots (NR) of plants treated with salinity, leaves (SiL) or roots (SiR) of plants treated with silicon alone or leaves (NSiL) or roots (NSiR) of plants treated with silicon and salinity. The heat map was constructed using the log10 of the mean value of three replicates of the precursor intensity (area under the peak) of three replicates of each analyte.
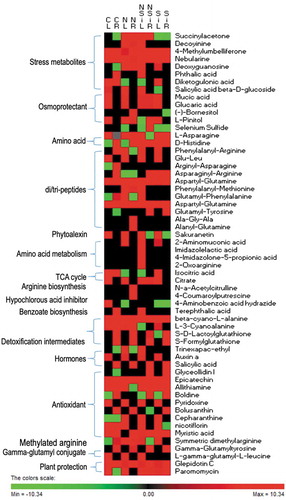
Figure 8. Boxplot presentation of some differentially accumulated metabolites involves oxidation scavenging pathways in date palm. The x-axis on the graphs represent the treatments while the y-axis represents the log10 value of the area under the MS peaks.
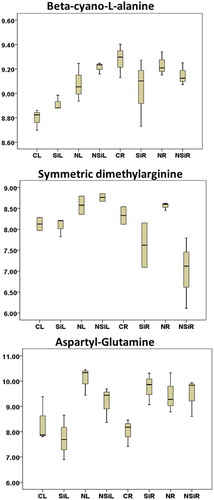
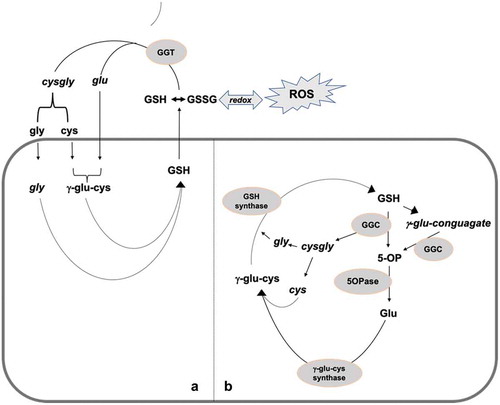
Figure 9. An illustration showing the involvement of metabolites isolated from silicon-treated plants grown under salinity in the methylglyoxal (MG) detoxification mechanism, via the glutathione (GSH)-dependent glyoxalase I and glyoxalase II and the glutathione (GSH)-independent glyoxalase III pathways.
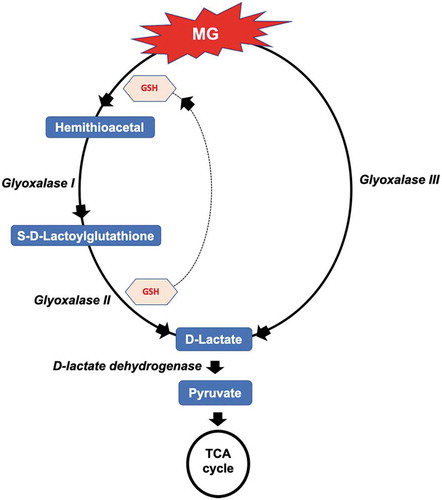
Figure 10. An illustration showing the involvement of metabolites isolated from silicon-treated plants grown under salinity in glutathione degradation and recycling, via the extracellular and vacuolar gamma-glutamyl cycle (a) and cytosolic GGC and 5-Opase (b) pathways.