Figures & data
Figure 1. PIP1-RLK7 activates stomatal immunity in Arabidopsis.
(a) GUS staining of the Arabidopsis leaf transgenically expressing prePIP1 promoter-controlled GUS gene. (b) Stomatal aperture in Col-0 plants under treatment with H2O or different concentration of PIP1. (c) Stomatal aperture in Col-0 and rlk7-2 mutants upon treatment with 10 μM PIP1. (d) Stomatal aperture in Col-0 and rlk7-2 mutants post spray-incubation with Pst DC3118 (2 × 10⁸ cfu ml−1). In B-D, epidermal peels were torn off from the leaves after treatments. Stomatal apertures (ratio of stomatal width: length) in the epidermal peels were measured. Error bars indicate SE for three independent replicates (n = 60 for each replicate). Asterisks represent significant differences (Student’s t test, P value < .01). (e and f) The growth of Pst DC3000 and Pst DC3118 in leaves of 5-week-old plants 3 days after spray-inoculation with bacteria at 2 × 10⁸ cfu ml−1 (e), or infiltration-inoculation with bacteria at 2 × 10⁵ cfu (f) ml−1. Error bars indicate SE for three independent replicates (n = 12 for each replicate). Asterisks represent significant differences (Student’s t test, P value < .01) compared to Col-0.
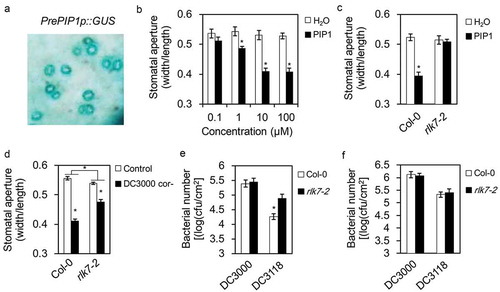
Figure 2. PIP1 cooperates with SA to regulates stomatal closure.
(a) Stomatal aperture in Col-0 plants under treatment with H2O, PIP1 (10 μM), PIP1 (10 μM) + COR (10 μM), SA (100 μM), or PIP1 (10 μM) + SA (100 μM). (b) Stomatal aperture in Col-0, sid2, and coi1 mutants under treatment with 10 μM PIP1. (c) Stomatal aperture in Col-0, aba2, and nced3 mutants under treatment with 10 μM PIP1. In A-C, epidermal peels were torn off from the leaves after treatments. Stomatal apertures (ratio of stomatal width: length) in the epidermal peels were measured. Error bars indicate SE for three independent replicates (n = 60 for each replicate). Asterisks or different letters represent significant differences (Student’s t test, P value < .01). (d) The PIP1 induction on gene transcriptions in Col-0 seedlings. Gene transcripts in ten-day-old Arabidopsis seedlings were quantified after seedlings were treated with 1 μM PIP1 for 1 hour (for SARD1, CBP60g, SID2, and PAL1) or 12 hours (for PR1, VSP2, and PDF1.2). (e) The induction of prePIP1 transcription in Col-0 leaves upon indicated treatments. Ten-day old Arabidopsis seedlings were pretreated with 10 μM MJ, 1 μM COR, or 100 μM SA for 6 hours, then were induced with 100 nM flg22 for 1 hour. (f) The prePIP1 transcription induction in Col-0, sid2, npr1, and coi1 seedlings upon flg22 treatments. Ten-day-old Arabidopsis seedlings were treated with 100 nM flg22 for 1 hour. In D-E, real-time quantitative PCR (qRT-PCR) was used to analyze the relative contents of gene transcripts. Error bars indicate SE for three independent replicates. Numbers in each column represent the induction fold.
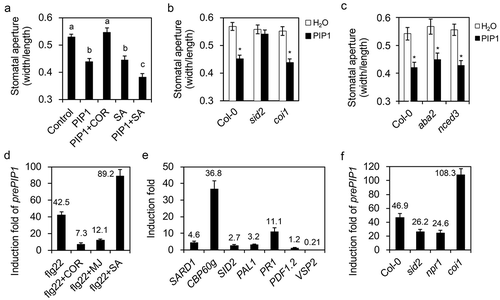
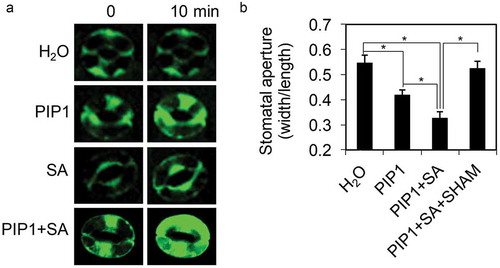
Figure 3. Extracellular ROS production-mediated PIP1-induced stomatal closure.
(a) Representative images showing fluorescence of guard cells stained with H2DCF-DA under different treatments. (b) Stomatal aperture in Col-0 plants under treatment with H2O, PIP1 (10 μM), PIP1 (10 μM) + SA (100 μM), or PIP1 (10 μM) + SA (100 μM) + SHAM (2 mM). Stomatal apertures (ratio of stomatal width: length) in the epidermal peels were measured. Error bars indicate SE for three independent replicates (n = 60 for each replicate). Asterisks represent significant differences (Student’s t test, P value < .01).