Figures & data
Figure 1. Analysis of induced expression products by SDS-PAGE (a) and Western Blot (b).
(a) M: Protein Marker; 1: The supernatant obtained after heat from E. coli cultures producing pET28a with IPTG; 2: The supernatant obtained after heat from E. coli cultures producing pET28a without IPTG; 3: The supernatant obtained after cell disruption from E. coli cultures producing WZY3-1; 4: The supernatant obtained after cell disruption and heat; 5: WZY3-1 protein purified with Ni2+ agarose gel affinity column. (b) M: Protein Marker; 1–3: protein purified with Ni2+ agarose gel affinity column.
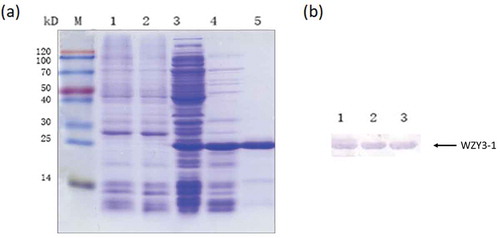
Figure 2. Protection of WZY3-1 protein on LDH activity under freezing and heat treatment. The of LDH activities were measured under freezing (f1, f2, f3) and heat (ht1, ht2, ht3) treatment with three cycles. Asterisks indicate statistically significant differences (*P < .05, **P < .01; Student’s t-test).
Figure 3. The growth curve of E. coli strains producing WZY3-1 protein and pET28a under normal conditions (a) or mannitol (b) and NaCl (c) treatments, with the growth state of E. coli strains producing WZY3-1 after −20°C (d) and 50°C (d) treatment.
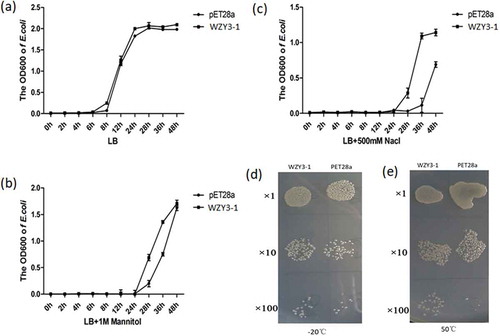
Figure 4. The screening of transgenic Arabidopsis. (a) The semi-quantitative test of wildtype (WT) and transgenic Arabisopsis (line 3–1, 3–5 and 3–7). (b) The growth state of WT and transgenic Arabisopsis under mannitol treatment. (c) The root length of WT and transgenic Arabidopsis under mannitol treatment. (d) The growth state of WT and transgenic Arabidopsis under drought stress for 0, 6, 7, 8 and 10 days. Asterisks indicate statistically significant differences (*P < .05, **P < .01; Student’s t-test).
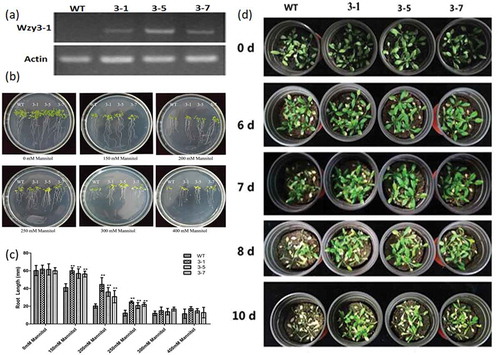
Figure 5. Measurement of physiological and biochemical indexes of transgenic and wild type plants treated with drought. (a) The water content of WT and transgenic Arabidopsis. (b) The total chlorphyll content of WT and transgenic Arabidopsis. (c) The proline content of WT and transgenic Arabidopsis. (d) The MDA content of WT and transgenic Arabidopsis. Asterisks indicate statistically significant differences (*P < .05, **P < .01; Student’s t-test).
Figure 6. Stomata aperture of wild type and transgenic Arabidopsis. (a) The stomaltal aperture measurements of WT and transgenic lines under normal (Mock), ABA and dehydration treatment. (b) Observation of stomata of WT and transgenic line.
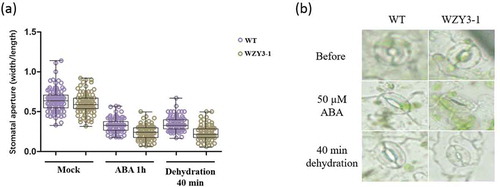
Figure 7. The expression of stomata closure related genes. Asterisks indicate statistically significant differences (*P < .05, **P < .01; Student’s t-test).