Figures & data
Figure 1. Construction of truncated OsC2DP fusion with GFP protein. (A) Protein domains of OsC2DP. The gray rectangle indicates the full length of OsC2DP. The white rectangle in gray diagonal lines represents the C2 domain. The rectangle in blue represents the transmembrane domain. The red arrow indicates the truncation site. (B) Construction of GFP-OsC2DP1−165 and GFP-OsC2DP166−290 fusion protein.
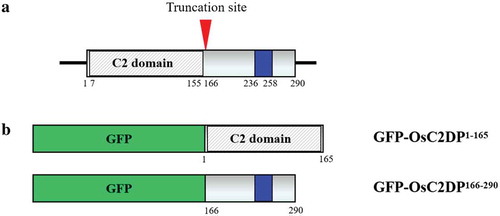
Figure 2. Subcellular localization of truncated OsC2DP under normal condition. (A-D) Co-expression of 35S::GFP and cytosolic marker Ds-Red (Red signal). (E-H, M-P) GFP-OsC2DP1−165 and GFP-OsC2DP166−290 fusion protein were co-expressed with Ds-Red, respectively. (I-L, Q-T) GFP-OsC2DP1−165 and GFP-OsC2DP166−290 were co-expressed with nuclear marker Ghd7 (Red signal), respectively. Scale bar = 10 μm.
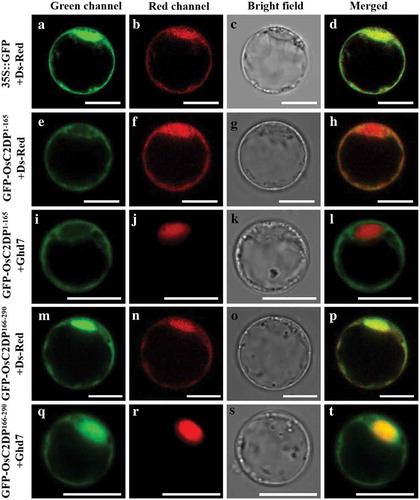
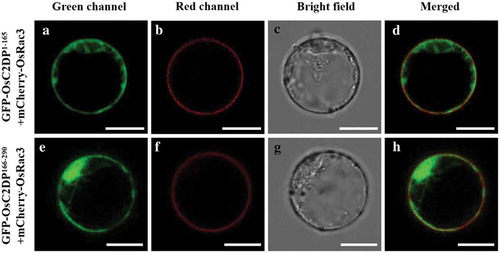
Figure 3. Subcellular localization of truncated OsC2DP under salt stress. After transformed by PEG solution, cells were incubated in W5 solution with the addition of 20 mM NaCl. Red fluorescence indicates the signal of plasma membrane marker mCherry-OsRac3. Scale bar = 10 μm.