Figures & data
Figure 1. Changes in the C to N ratio (derived from 2-OG/Glu) upon TOR inhibition in Chlamydomonas.
(a) Over 24-h cell cycle (the red-star symbol in the plot marks the commitment point (CP) of the cell cycle, where the cells grow large enough to commit to divide); (b) in the presence of light (batch culture); (c) dark; (d) dark and no nitrogen; and (e) extended darkness (dotted line indicates the start of extended dark phase). Sampling time is given on the x-axes, while relative intensities are given on the y-axes. Note that 0 h sampling was carried out only in (d) to account for the error introduced due to the nitrogen starvation, before applying rapamycin treatmentCitation.11 The metabolites were measured using GC-MS platform. Samples are represented as the mean of six replicates ± SE (a) and five replicates ± SE (b–e). Significance testing was performed by ANOVA2. The data plotted in (a–d) were retrieved from previously published worksCitation.11
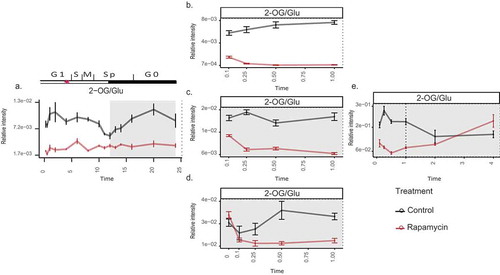
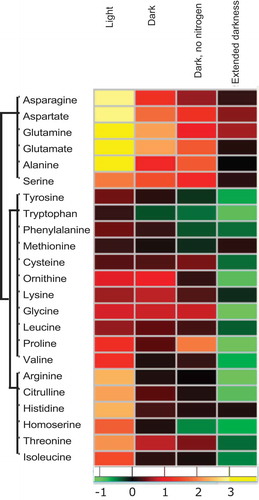
Figure 2. Changes in amino acid levels depend on the resource availability.
Heatmap showing fold change (Log 2) in the amino acid levels after 1 h of treatment with 5 µM rapamycin or equal concentration of drug vehicle (in light, dark, and dark and no nitrogen experiments)Citation10 and after 4 h of the same treatment in extended dark experiment. Fold changes were calculated by dividing the mean of rapamycin samples (five replicates) with the mean of control samples (five replicates). The data for the first three experiments are obtained from the study by Perez-Perez et al.,Citation10 while the extended darkness experiment is conducted in the present study.