
Figures & data
Table 1. Statistics of small RNA sequences from the PA64S-H and PA64S-L libraries.
Figure 1. Summary of unique and total of small RNAs in non-coding RNAs in GenBank between PA64S-H and PA64S-L. a,b. Unique and total sRNAs in PA64S-H. c.d. Unique and total sRNAs in PA64S-L.
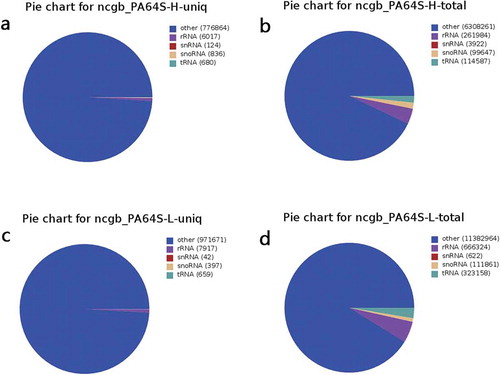
Figure 2. Length distribution of small RNAs in the different libraries. a. PA64-H. b. PA64-L.
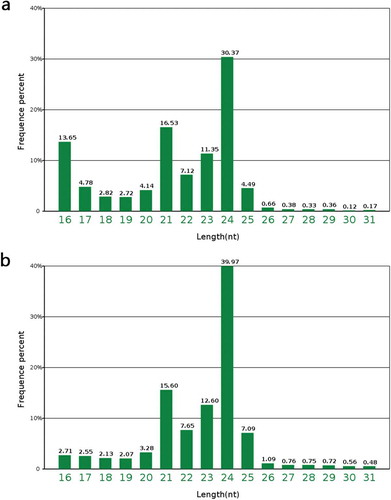
Figure 3. Venn diagram analysis of expressed genes of PA64S-H and PA64S-L. a. known miRNA. b. novel miRNA.
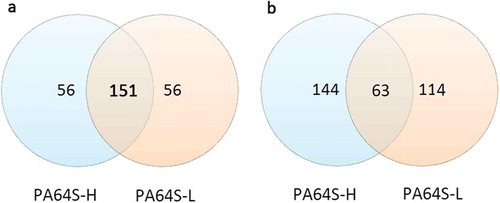
Figure 4. The analysis of miRNA first nucleotide bias and nucleotide bias at each position in known miRNAs.
a. The miRNA first nucleotide bias analysis of known miRNAs in PA64S-H.b. The miRNA first nucleotide bias analysis of known miRNAs in PA64S-L.c. The miRNA nucleotide bias at each position analysis of known miRNA in PA64S-H.d. The miRNA nucleotide bias at each position analysis of known miRNA in PA64S-L.
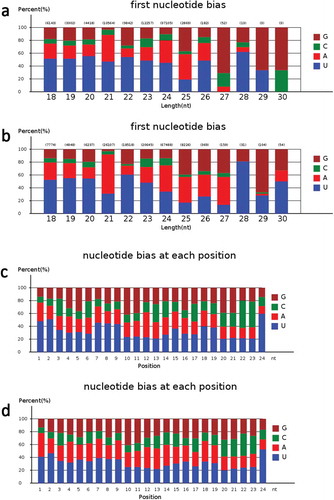
Figure 5. Comparison and validation of the differential expression of known miRNA in the different libraries. a. Scatter plot of expression rations for known in Pa64S-H and PA64S-L. Red points represent miRNAs with fold change>2, showing upregulated miRNAs in PA64S-L; blue points represent miRNAs with 1/2≤ fold change ≤2, indicating equally expressed miRNAs in both libraries; green points represent miRNAs with fold change<1/2, meaning downregulated miRNAs in PA64S-L. Fold change = normalized expression in PA64S-L/normalized expression in PA64S-H. b. Comparison of the miRNA expression levels between PA64S-H and PA64S-L by qPCR for MIR531, MIR6300, MIR9773, MIR1118, MIR2275, MIR9473. The experiments were performed with three biological replicates, and the error bars represent the standard error.
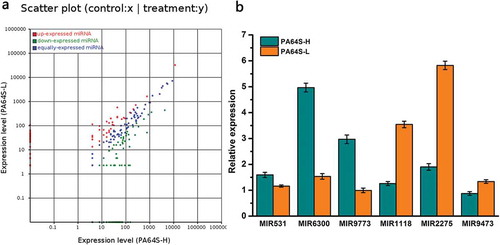
Figure 6. Gene ontology analysis for the targets of the differential expression of known and novel miRNAs based on the terms of cellular component, biological process and molecular function in PA64S-H and PA64S-L. a. known miRNAs. b. novel miRNAs.
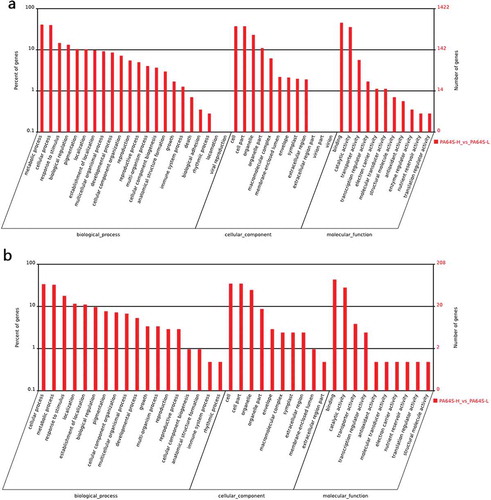
Table 2. Some KEGG enrichment pathways analysis.