Figures & data
Figure 1. Climate diagram for Jinan, Shandong, China.
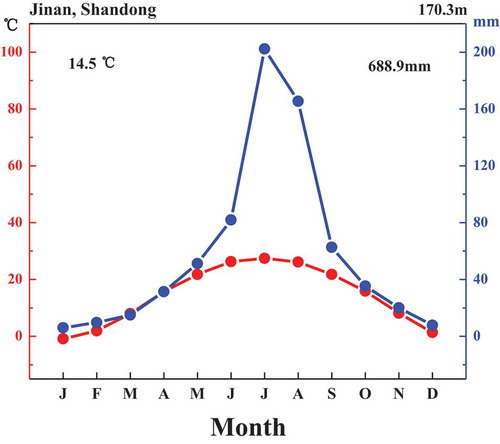
Table 1. Features of the experimental plants and leaf chamber temperature (Tb) during measurements.
Table 2. Detection limits and recoveries of standards of GA3, IAA, and ABA.
Table 3. The concentration of phytohormone (GA3, IAA, ABA) and the ratios of GA3/ABA and IAA/ABA in three tree species in Jinan.
Figure 2. The responses of stomatal conductance (gs), net photosynthesis rate (An), transpiration rate (E) and water use efficiency (WUE) to vapor pressure deficit (VPD) in F. chinensis, P. alba var. and P. tomentosa in Jinan, China. Error bars represent standard errors of gs, An and E with 3–7 replicates measurements.
Figure 3. Comparison of stomatal conductance predicted by the Leuning model and measured data for the three tree species in Jinan, China. The diagonal line is the 1:1 relationship between predicted data and measured data. The σ value is the difference between the 1:1 line and measured data (Root Mean Square Error, RMSE).
Figure 4. Comparison of stomatal conductance predicted by the optimal stomatal model and measured data for the three tree species in Jinan, China. The diagonal line is the 1:1 relationship between predicted data and measured data. The σ value is the difference between the 1:1 line and measured data (Root Mean Square Error, RMSE).
Table 4. Nonlinear simulation formula of gs to VPD and gs-max corresponding to VPD and RH.
Figure 5. The concentration of abscisic acid (ABA) and the sensitivity of stomatal conductance (gs) to vapor pressure deficit (VPD) in the three trees in different seasons in Jinan. The sensitivity of gs to VPD is described by Root Mean Square Error (RMSE, σ, n = 9).