Figures & data
Figure 1. Difference in structure between antifreeze proteins type I and type III. This figure is copyrighted by CapicciottiCitation24
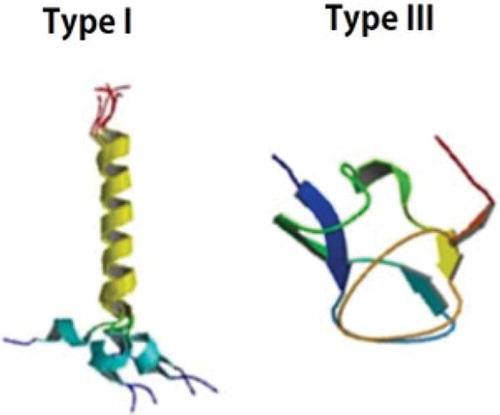
Figure 2. Comparison of the size of seedlings germinated from tomato seeds treated with AFP I (100, 300, and 500 µg/l) and control (0 µg/l).
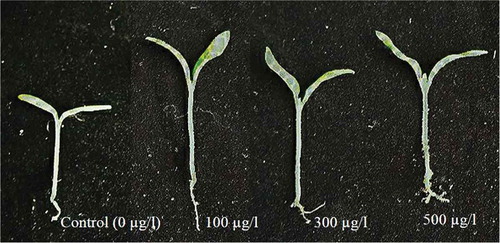
Figure 3. Comparison of germination percentages of tomato seeds treated with or without antifreeze proteins type I (a) and type III (b) under the growing condition (at 4°C for 5 d, followed by 10°C for 7 d and 20°C for 8 d. Control indicates the seeds soaked only in water. Data represent means of the replications, and bars indicate errors of three replications.
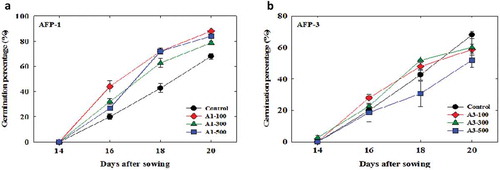
Figure 4. Transcript levels of Plasma membrane H+-ATPase in seedlings germinated from the seeds grown in the normal growing condition (at 25°C) and those treated with or without antifreeze proteins type I (a) and type III (b) under low temperature condition (at 4°C for 5 d, followed by 10°C for 7 d and 20°C for 4 d. Control indicates the seeds soaked only in water and exposed to low temperature, and 25°C indicates the seeds soaked only in water and grown in the normal growing condition (25°C) for 16 days. Data represent means of three biological replicates, and bars indicate errors of three biological replicates.
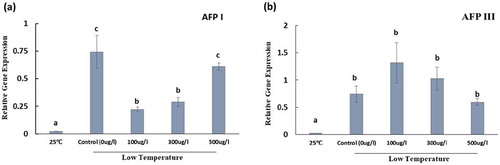
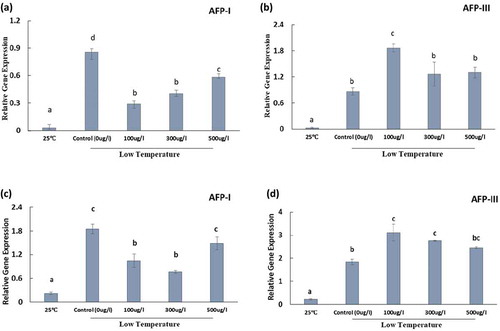
Figure 5. Transcript level of antioxidant-related genes SOD (a and b) and CAT1 (c and d) expressed in seedlings germinated from the seeds grown in the normal growing condition (at 25°C) and those treated with or without antifreeze proteins type I and III under the low temperature condition (at 4°C for 5 d, followed by 10°C for 7 d and 20°C for 4 d. Control indicates the seeds soaked only in water and exposed to low temperature, and 25°C indicates the seeds soaked only in water and grown in the normal growing condition (25°C) for 16 days. Data represent means of the biological replicates, and bars indicate errors of three biological replicates.