1,900
Views
11
CrossRef citations to date
0
Altmetric
Research Paper

Iron toxicity-induced physiological and metabolite profile variations among tolerant and sensitive rice varieties

ORCID Icon, ORCID Icon, ORCID Icon & ORCID Icon
Article: 1682829 | Received 09 Aug 2019, Accepted 14 Oct 2019, Published online: 28 Oct 2019

Figures & data

Figure 1. The effect of Fe toxicity stress on growth rate (a–b), leaf bronzing score (c), chlorophyll content (d), and malondialdehyde (MDA) (e–f) in four rice varieties. Bars represent standard error. Control = 0 ppm FeSO4.7H2O; Fe = 400 ppm FeSO4.7H2O.
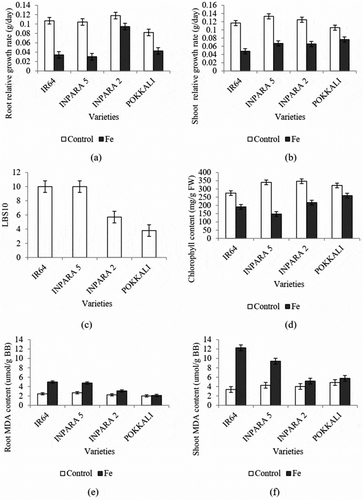
Figure 1. The effect of Fe toxicity stress on growth rate (a–b), leaf bronzing score (c), chlorophyll content (d), and malondialdehyde (MDA) (e–f) in four rice varieties. Bars represent standard error. Control = 0 ppm FeSO4.7H2O; Fe = 400 ppm FeSO4.7H2O.

Figure 2. The comparison of metabolite in each vegetative organ (a) and each variety (b) under control and Fe toxicity stress. 0 ppm = control; 400 ppm = Fe toxicity stress.
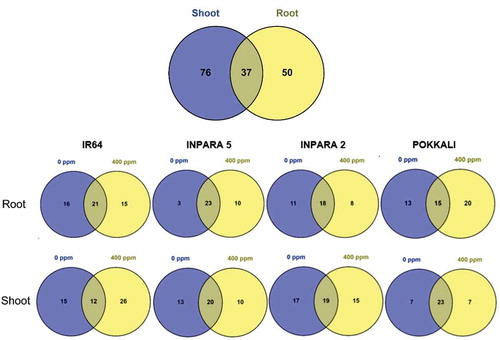
Figure 2. The comparison of metabolite in each vegetative organ (a) and each variety (b) under control and Fe toxicity stress. 0 ppm = control; 400 ppm = Fe toxicity stress.

Figure 3. The comparison of metabolite composition of roots and shoots based on its compound group. The categorization based on various databases, i.e. PubChem (https://pubchem.ncbi.nlm.nih.gov/), KEGG Pathway (https://www.genome.jp/kegg/pathway.html), HMDB (http://www.hmdb.ca/), LIPID MAPS (http://lipidmaps.org/data/structure/LMSDSearch.php), CAMEO (https://cameochemicals.noaa.gov/search/simple), ChemSpider (http://www.chemspider.com/).
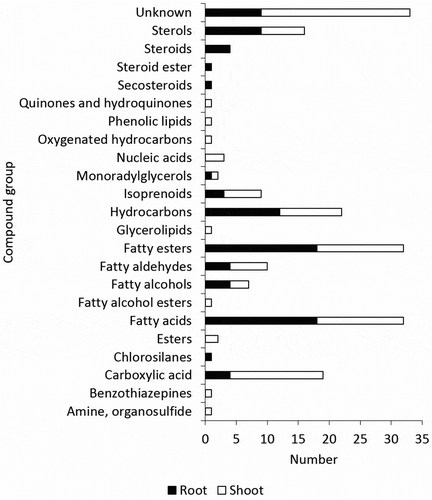
Figure 3. The comparison of metabolite composition of roots and shoots based on its compound group. The categorization based on various databases, i.e. PubChem (https://pubchem.ncbi.nlm.nih.gov/), KEGG Pathway (https://www.genome.jp/kegg/pathway.html), HMDB (http://www.hmdb.ca/), LIPID MAPS (http://lipidmaps.org/data/structure/LMSDSearch.php), CAMEO (https://cameochemicals.noaa.gov/search/simple), ChemSpider (http://www.chemspider.com/).

Figure 4. Heatmap analysis combined with hierarchical clustering analysis of metabolites in the roots of rice under control and Fe toxicity stress. Analysis using normalized data with mean-centered via http://www.metaboanalyst.ca. 0 = 0 ppm (control); 400 = 400 ppm FeSO4.7H2O.
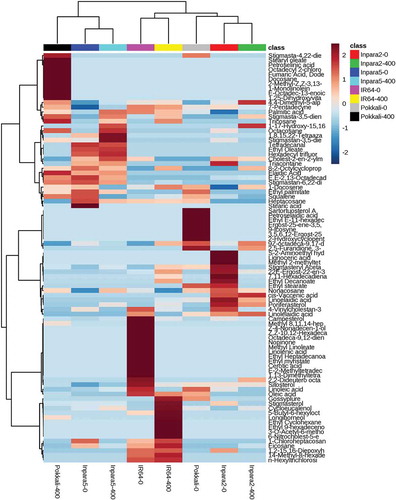
Figure 4. Heatmap analysis combined with hierarchical clustering analysis of metabolites in the roots of rice under control and Fe toxicity stress. Analysis using normalized data with mean-centered via http://www.metaboanalyst.ca. 0 = 0 ppm (control); 400 = 400 ppm FeSO4.7H2O.
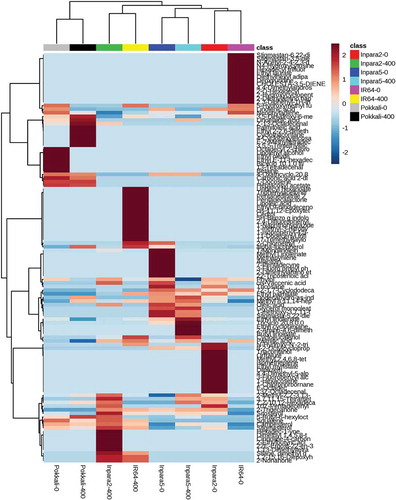
Figure 5. Heatmap analysis combined with hierarchical clustering analysis of metabolites in the shoots of rice under control and Fe toxicity stress. Analysis using normalized data with mean-centered via http://www.metaboanalyst.ca. 0 = 0 ppm (control); 400 = 400 ppm FeSO4.7H2O.

Figure 5. Heatmap analysis combined with hierarchical clustering analysis of metabolites in the shoots of rice under control and Fe toxicity stress. Analysis using normalized data with mean-centered via http://www.metaboanalyst.ca. 0 = 0 ppm (control); 400 = 400 ppm FeSO4.7H2O.

Table 1. Partial least-squares discriminant analysis (PLS-DA) parameter as distinguishing between control and Fe toxicity stress condition in four rice varieties based on their metabolite profile.

Figure 6. The difference of tolerance level of rice based on their metabolite profile in shoot (a), root (b), and each variety (c). The analyses were performed by principal component analysis (PCA) and partial least squares-discriminant analysis (PLS-DA). 0 ppm = control; 400 ppm = Fe toxicity stress.
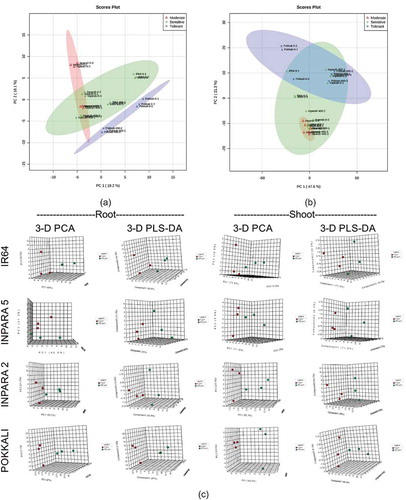
Figure 6. The difference of tolerance level of rice based on their metabolite profile in shoot (a), root (b), and each variety (c). The analyses were performed by principal component analysis (PCA) and partial least squares-discriminant analysis (PLS-DA). 0 ppm = control; 400 ppm = Fe toxicity stress.

Table 2. The significant level of each selected metabolites to the given treatments.

Table 3. Pathway analysis between tissues and rice varieties based on the selected metabolites to the given treatments.

Figure 7. The comparison of elaidic acid in root (a), linoleic acid in root (b), and linolenic acid in shoot (c) between control and Fe toxicity stress. 0 ppm = control; 400 ppm = Fe toxicity stress. Bars represent standard error.
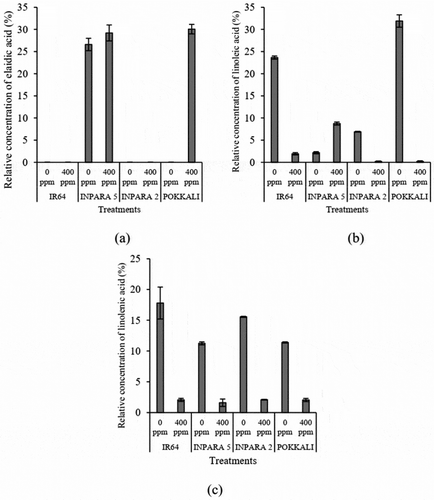
Figure 7. The comparison of elaidic acid in root (a), linoleic acid in root (b), and linolenic acid in shoot (c) between control and Fe toxicity stress. 0 ppm = control; 400 ppm = Fe toxicity stress. Bars represent standard error.

Figure 8. The correlation analysis between morpho-physiological responses and fatty acid (elaidic-, linoleic-, and linolenic acid) concentration in control (a) and Fe toxicity stress (b). RRGR = root growth rate; MDAR = MDA concentration in root; SRGR = shoot growth rate; CHL = chlorophyll; MDAS = MDA concentration in shoot; LBS10 = leaf bronzing score 10 d after treatment; LINOLEIC_R = linoleic acid concentration in root; ELAIDIC_R = elaidic acid concentration in root; LINOLENIC_S = linolenic acid concentration in shoot.
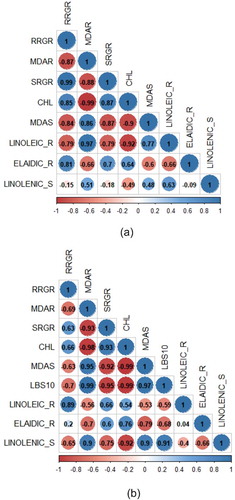
Figure 8. The correlation analysis between morpho-physiological responses and fatty acid (elaidic-, linoleic-, and linolenic acid) concentration in control (a) and Fe toxicity stress (b). RRGR = root growth rate; MDAR = MDA concentration in root; SRGR = shoot growth rate; CHL = chlorophyll; MDAS = MDA concentration in shoot; LBS10 = leaf bronzing score 10 d after treatment; LINOLEIC_R = linoleic acid concentration in root; ELAIDIC_R = elaidic acid concentration in root; LINOLENIC_S = linolenic acid concentration in shoot.

Reprints and Corporate Permissions

Please note: Selecting permissions does not provide access to the full text of the article, please see our help page How do I view content?

To request a reprint or corporate permissions for this article, please click on the relevant link below:

Academic Permissions

Please note: Selecting permissions does not provide access to the full text of the article, please see our help page How do I view content?

Obtain permissions instantly via Rightslink by clicking on the button below:

If you are unable to obtain permissions via Rightslink, please complete and submit this Permissions form. For more information, please visit our Permissions help page.