
Figures & data
Figure 1. Relative RNA expressions of the Arabidopsis thaliana superoxide dismutase (AtSOD) and Cucurbita moschata SOD (CmSOD) genes in non-transgenic (NT) Arabidopsis plants and transgenic Arabidopsis lines under chilled conditions.
A. The AtSOD gene expression in NT plants and T3 homozygote AtSOD1 ~ 5 lines.
B. The CmSOD gene expression in NT plants and T3 homozygote CmSOD1 ~ 10 lines.
Total RNA in all tested plants was extracted from leaves of 2-week-old plants subjected to 4°C for 0 (control), 6, 72, and 192 h of chilling treatment. Relative amounts were calculated and normalized with respect to AtActin-8 RNA. Values are the means of three replicates with the corresponding standard deviation. The gene expression is compaired to NT plants and an asterisk indicates a significance level of p ≤ 0.05.
Figure 2. Relative RNA expressions of Arabidopsis thaliana (At)CBF2, AtRD29A, and AtRD29B genes in non-transgenic (NT) Arabidopsis plants and transgenic Arabidopsis lines under chilled conditions.
A. The AtCBF2 gene expression in NT plants and T3 homozygote AtSOD1 ~ 5 lines,
B. The AtCBF2 gene expression in NT plants and T3 homozygote CmSOD1 ~ 10 lines,
C. The AtRD29A gene expression in NT plants and T3 homozygote AtSOD1 ~ 5 lines,
D. The AtRD29A gene expression in NT plants and T3 homozygote CmSOD1 ~ 10 lines,
E. The AtRD29B gene expression in NT plants and T3 homozygote AtSOD1 ~ 5 lines,
F. The AtRD29B gene expression in NT plants and T3 homozygote CmSOD1 ~ 10 lines,
Total RNA in all tested plants was extracted from 2-week-old plants subjected to 4°C for 0 (control), 6, 72, and 192 h of chilling treatment. Relative amounts were calculated and normalized with respect to AtActin-8 RNA. Values are the means of three replicates with the corresponding standard deviation. The gene expression is compaired to NT plants and an asterisk indicates a significance level of p ≤ 0.05.
Figure 3. Western blot analysis of the Arabidopsis thaliana superoxide dismutase (AtSOD)1 ~ 5 (a) and Cucurbita moschata SOD (CmSOD)1 ~ 10 (b) transgenic lines and comparisons with non-transgenic (NT) plants. Forty micrograms of total proteins was used for each sample. The molecular weights of AtSOD at 29 kDa (a) and CmSOD at 24 kDa (b) are indicated by an arrowhead.
Figure 4. Superoxide dismutase (SOD) activity (a, b) and superoxide (•O2−) accumulation according to in situ reactive oxygen species (ROS) staining (c, d) in leaves of non-transgenic (NT) Arabidopsis plants and T3 homozygote transgenic lines. Arabidopsis thaliana (At)SOD1 ~ 5 (a, c) and Cucurbita moschata (Cm)SOD1 ~ 10 (b, d) transgenic lines were compared to NT plants after exposure to a chilling condition for 0 (control) and 192 h. Values are the means of three replicates with the corresponding standard deviation. The gene expression is compaired to NT plants and an asterisk indicates a significance level of p ≤ 0.05.
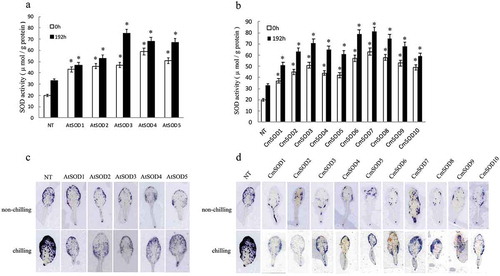
Figure 5. Relative RNA expressions of the Arabidopsis thaliana (At)CBF2, AtRD29A, and AtRD29B genes in non-transgenic (NT) Arabidopsis plants and transgenic Arabidopsis lines after 1 μM abscisic acid (ABA) treatment followed by 0 to 192 h of chilling stress.
A. The AtCBF2 gene expression in NT plants and T3 homozygote AtSOD3 ~ 5 and Cucurbita moschata (Cm)SOD6 ~ 8 lines.
B. The AtRD29A gene expression in NT plants and T3 homozygote AtSOD3 ~ 5 and CmSOD6 ~ 8 lines.
C. The AtRD29B gene expression in NT plants and T3 homozygote AtSOD3 ~ 5 and CmSOD6 ~ 8 lines.
Total RNA in all tested plants was extracted from 2-week-old plants after 1 μm ABA treatment followed by 4°C for 0 (control), 6, 72, and 192 h of chilling treatment. Relative amounts were calculated and normalized with respect to AtActin-8 RNA. Values are the means of three replicates with the corresponding standard deviation. The gene expression is compaired to NT plants and an asterisk indicates a significance level of p ≤ 0.05.
Figure 6. Chlorophyll contents and seedling growth of non-transgenic (NT) and transgenic Arabidopsis thaliana superoxide dismutase (AtSOD)1 ~ 5 (a) and Cucurbita moschata (Cm)SOD1 ~ 10 (b) lines after exposure to chilling for 0 (control) or 192 h. Values are the means of three replicates with the corresponding standard deviation. An asterisk indicates a significance level of p ≤ 0.05.
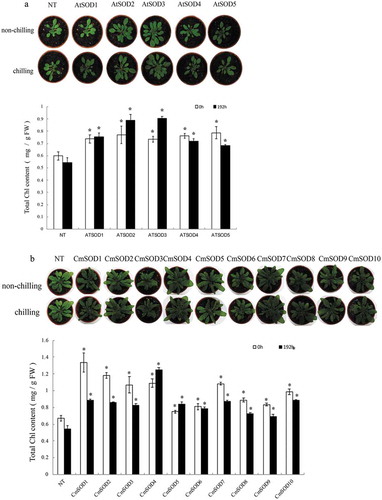
Figure 7. Abscisic acid (ABA)-sensitive AtRD29A, AtCBF2 and AtRD29B transcriptional regulation signaling pathways in transgenic Arabidopsis thaliana superoxide dismutase (AtSOD) and Cucurbita moschata (Cm)SOD Arabidopsis lines under chilling (4°C) treatment. The AtCBF2, AtRD29A, and AtRD29B genes were highly expressed in all transgenic lines compared to non-transgenic (NT) plants under chilling treatment. Overexpression of AtSOD activated expressions of downstream target genes by ABA-enhanced AtRD29A or ABA-repressed AtCBF2 and AtRD29B transcriptional regulation signaling pathways in transgenic Arabidopsis under chilling stress.
Table 1. Paired primers used in the study.