
Figures & data
Figure 1. Comparison of salt tolerance between different Lei-Qiong traditional rice samples. Twenty-eight kinds of Lei-Qiong rice samples were grown on Hoagland solution for about 3 weeks, and then fresh Hoagland solution with 0.5% NaCl was added for three times in every second day (the old solution is running out at this time point). After that, solution without NaCl was added again when the solution running out again. Salt tolerance capacity was roughly estimated by the survival rate in 10 d after salt treatment.
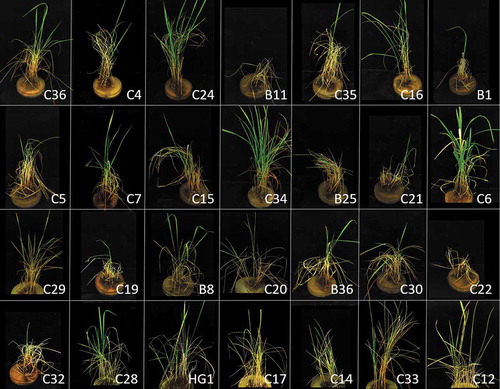
Figure 2. Germination rates of different rice landraces under salt treatment. Germination rate of C34, C24, HG1, Nona Bokra, and IR29 under 0 mM, 50 mM, 100 mM, 150 mM, 200 mM, 250 mM, and 300 mM NaCl treatments. (A) Pictures of seed germination under different conditions after 6 d of incubation. Names of rice samples were shown at left of each line, NaCl concentrations were indicated on top of each row. (B) Germination rates under different conditions. Data were mean of three replicates, no less than 50 seeds were used in each replicate.
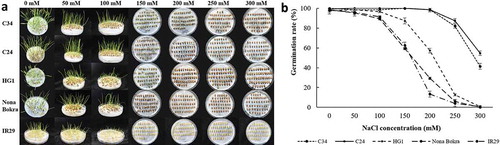
Figure 3. Performances of different rice landraces under salt treatments. Three-weeks old C34, C24, HG1, Nona Bokra, and IR29 seedlings were treated with 0 mM, 80 mM, 100 mM, 120 mM, and 150 mM NaCl for 10 d. Relative inhibition rate was indicated by relative reduction of plant height or plant root compared to control condition (0 mM NaCl). Each treatment was having 3 replicates, 10 plants were calculated in each replicate. (A) Relative inhibition rates of aerial part. (B) Relative inhibition rates of roots. (C) Water contents of rice seedlings. The harvested materials were dried in an oven for 3 d. (D) Chlorophyll contents measurement. Leaves were harvested and processed as shown in methods. (E) Pictures of seedlings after treatment, NaCl concentrations were indicated on the top of each panel. Data key: Different letters stand for having significant difference (P < 0.05) within the same treatments. Ruler bars (shown in red), 20 cm.
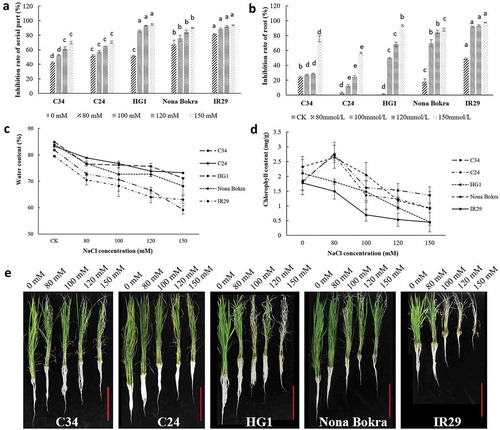
Figure 4. MDA and proline contents of rice seedlings. Four-weeks old C34, C24, HG1, Nona Bokra, and IR29 seedlings were treated by 100 mM NaCl treatments for 5 d and 10 d, respectively. Seedlings were harvested after treatment, seedlings without NaCl treatment were used as control. (A) Measurement of MDA contents. (B) Measurement of proline contents. Each treatment was having 3 replicates, 12 plants were calculated in each replicate. Data key: Different letters stand for having significant difference (P < .05) within the same treatments. Asterisks (*) indicate significant differences between control and salt-stressed seedlings of the same genotype which were determined by Student’s t-test (*0.01 < P ≤ 0.05, **0.001 < P ≤ 0.01, ***P ≤ 0.001).
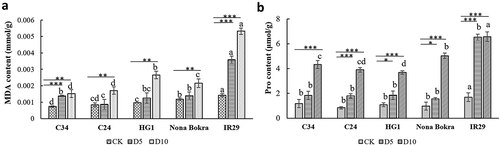
Figure 5. POD and CAT activities of seedlings. Four-weeks old C34, C24, HG1, Nona Bokra, and IR29 seedlings were treated by 100 mM NaCl treatments for 5 d and 10 d, respectively. Seedlings were harvested after treatment, seedlings without NaCl treatment were used as control. (A) POD activity. (B) CAT activity. Each treatment was having 3 replicates, 12 plants were calculated in each replicate. Data key: Different letters stand for having significant difference (P < .05) within the same treatments. Asterisks (*) indicate significant differences between control and salt-stressed seedlings of the same genotype which were determined by Student’s t-test (*0.01 < P ≤ 0.05, **0.001 < P ≤ 0.01, ***P ≤ 0.001).
