Figures & data
Figure 1. Misregulation of miR160 results in altered leaf curvature. (a) Photographs of 6-week old wildtype (WT), miR160-OE and miR160-KD plants. White arrows in the middle panel show curved leaves of miR160-OE plants. (b) Quantitative real-time PCR-based expression analysis of miR160 in the leaf tissues of WT, vector control (VC), and two independent lines each of miR160 overexpression and knockdown plants. Bars indicate mean ± SD from four biological replicates. Statistically significant differences compared to WT samples were estimated using Student’s unpaired t-test (p < .05, two-tailed), ns indicates not significant. (c) A closer look at the individual leaves of miR160-OE and miR160-KD independent lines. (d) An illustration of the method used to calculate longitudinal and transverse curvature indices, which was originally used by Liu et al, 2010. (e-f) The longitudinal (e) and transverse (f) curvature indices of leaves emerging from the 5th-node of 6-week old plants. Data are represented as boxplots with gray-filled circles representing data points from eight individual plants and black filled triangles representing mean of the data points. Statistically significant differences were estimated using one-way ANOVA followed by a Tukey HSD test (p < .05).
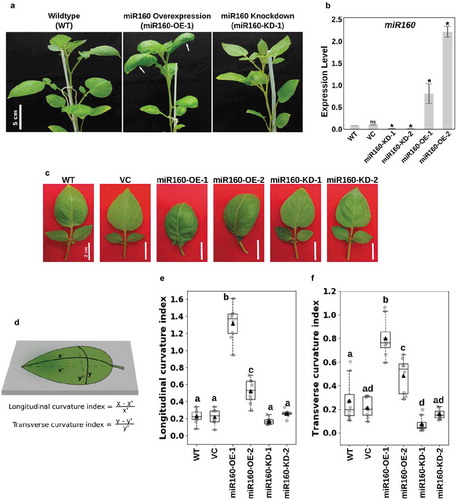
Figure 2. Both overexpression and knockdown of miR160 affect multiple leaf characteristics. (a) Silhouettes of all the leaves collected from 6-week old plant arranged in the order of youngest (L1) to oldest (L12). Cuts were made along the margin of the leaves to flatten it. The numeral on top of each leaf indicates the number of cuts that was required to flatten the leaf: miR160-OE leaves required more cuts and miR160-KD leaves required less cuts than WT. (b) A leaf from the miR160-OE-1 plants before and after the cuts was made at its margin. (c-j) Various morphometric parameters, as indicated along the y-axis, were measured using the leaf emerging from the 5th-node of 6-week old plants (L5). Each boxplot is prepared using data from eight individual plants (indicated by gray-filled circles), except blade area for which six individual plants were used. The black-filled triangle represents the mean of the data. Statistically significant differences were estimated using one-way ANOVA followed by a Tukey HSD test (p < .05). This experiment was performed three times with similar results.
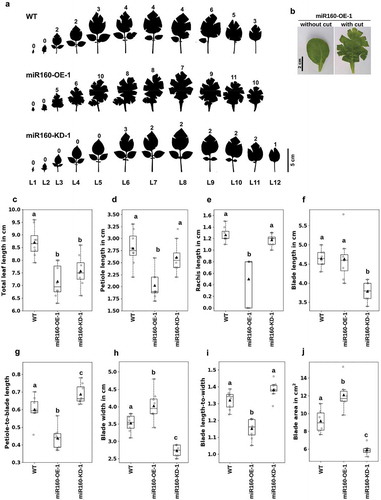
Figure 3. miR160 targets the class C auxin response factors (ARF) in potato. (a) Cleavage site mapping assay revealed that StARF10, StARF16 and StARF17 undergo miR160-guided cleavage. The arrow and the numbers indicate the site at which miR160 cleaves the ARFs and the frequency with which we were able to recover cleaved targets using RLM-RACE assay. (b-d) qRT-PCR-based expression analysis of StARF10 (b), StARF16 (c) and StARF17 (d) in the leaves of WT, miR160-OE-1 and miR160-KD-1 leaf samples. Bars indicate mean ± SD from four biological replicates. Statistically significant differences compared to WT samples were estimated using Student’s unpaired t-test (p < .05, two-tailed), ns indicates not significant. The expression analysis was performed twice with similar results. (e) The expression profile of StARF10, StARF16 and StARF17 transcripts across various tissue types as analyzed by the RNA-seq data set from the PGSC database. Red arrow indicates the tissue with the highest expression for each transcript.
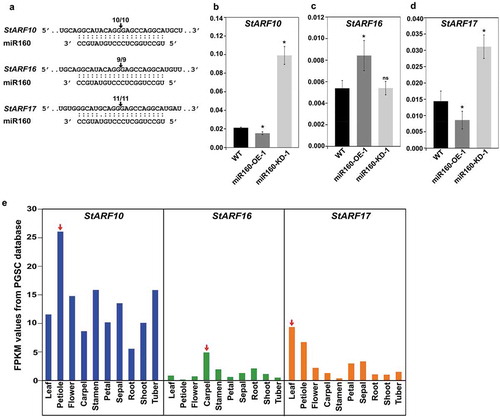
Figure 4. miR160-OE plants are auxin hypersensitive and miR160-KD plants are hyposensitive. (a) Roots of plants grown without or with (0.3 or 1.0 μM) auxin (2,4-D) for 12 days. (b) Quantification of root length after exogenous auxin treatment. Boxplots were prepared using data from 12 individual plants in each treatment. Grey-filled circles are data from individual plants and black-filled triangle is the mean of the data points. Drastic reduction in root length in miR160-OE-1 plants at 0.3 μM auxin treatment shows that miR160-OE plants are hypersensitive to auxin. Statistically significant differences were estimated using one-way ANOVA followed by a Tukey HSD test (p < .05). (c) Percentage reduction in root length in 1.0 μM treatment compared to untreated control shows that miR160-KD-1 plants are hyposensitive to auxin. This experiment was performed twice with similar results.
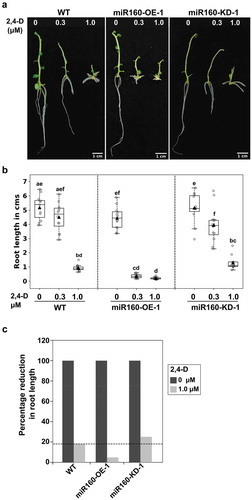
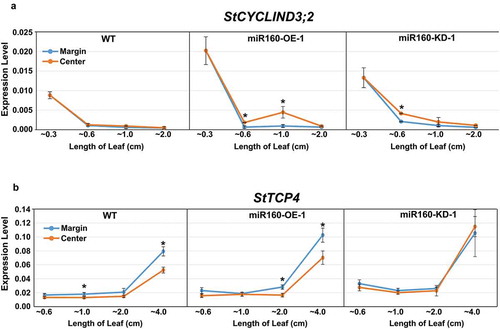
Figure 5. Expression of StCYCD3;2 and StTCP4 are altered in miR160 transgenic plants. (a-b) qRT-PCR-based expression analysis of StCYCD3;2 (a) and StTCP4 (b) in the center and margin regions of leaves of different lengths from WT, miR160-OE-1 and miR160-KD-1 plants. Values indicate mean ± SD from at least two biological replicates. Statistically significant differences were estimated using Student’s unpaired t-test (p < .05, two-tailed).