Figures & data
Figure 1. Internode and cell length in wild type, Kinmaze, and bc1 mutant. (a) Length of first to fifth internodes in wild type (white) and bc1 mutant (gray). Internodes are numbered from top to bottom. The main culm in each plant was used for measurement. Values are averages of 20 biological replicates, and bars represent standard errors. Statistical analysis was performed using Student’s t-test (**p < .01; *p < .05). (b) Length of cells at 3.5 cm from lower node in elongating second internodes. Values are averages of 50 cells (10 cells per plant), and bars represent standard errors. Statistical analysis was performed using Student’s t-test, and P value is shown at top of graph. (c) Longitudinal sections of elongating second internode at 3.5 cm from lower node in wild type, Kinmaze (left) and bc1 mutant (right). Bar = 100 μm.
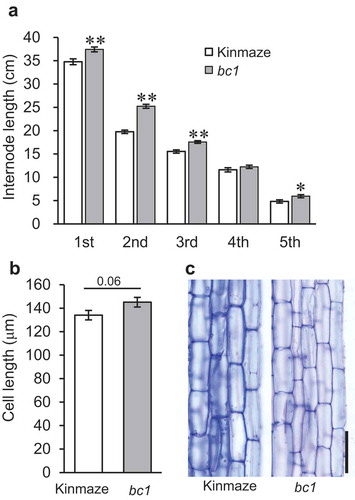
Figure 2. Histochemical observation of elongating second internode of rice. (a) Positions of sections for histochemical observation and segments of S1 to S4 for subsequent analyses are shown. Triangles indicate nodes. Bar = 2 cm. (b and c) Transverse sections stained with phloroglucinol reaction of cell wall lignin in wild type, Kinmaze (b), and bc1 mutant (c) indicating delayed lignin deposition in bc1 mutant. Arrowheads indicate phloroglucinol stained mestome sheath. Bars = 50 μm. CF, cortical fiber; LVB, large vascular bundle; MX, metaxylem; PX, protoxylem; SVB, small vascular bundle.
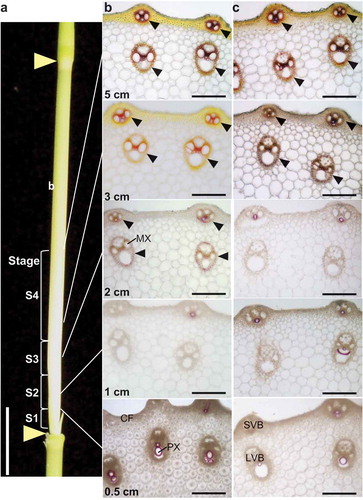
Figure 3. Longitudinal sections of elongating second internode at 0.5 cm, 1 cm, and 2 cm from lower node of wild type, Kinmaze (a), and bc1 mutant (b). Sections at 0.5 and 1 cm showed small cells, and section from 2 cm showed nearly elongated cells. Bars = 200 μm.
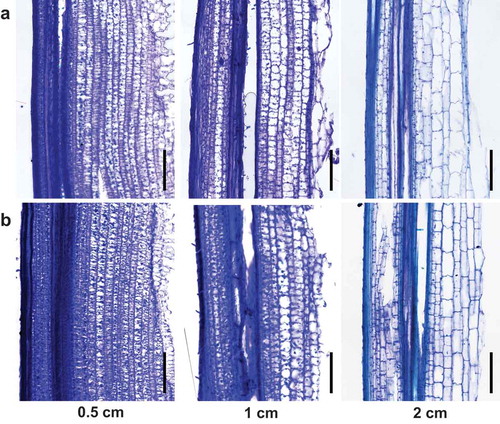
Figure 4. Reverse transcriptional PCR of BC1 gene amplified from cDNA derived from each stage of elongating second internodes of wild type, Kinmaze (a), and bc1 mutant (b). Actin was used as an RT-PCR control.
Figure 5. Contents of cell wall components at S1 to S4 stages of elongating internodes shown in Figure 2. Cellulose content per AIR (a), acetyl-bromide lignin per AIR (b), alkaline-soluble FA (c) and pCA (d) per AIR in wild type, Kinmaze (white bar), and bc1 mutant (gray bar) cell walls are shown. Values are averages of three biological replicates, and bars represent standard errors. Statistical analysis was performed using Tukey’s test. Different letters indicate significant difference at p < .05.