
Figures & data
Table 1. Root and leaf anatomy in soybean plants treated with EBR and subjected to waterlogging
Figure 1. Root and leaf cross sections in soybean plants treated with EBR and subjected to waterlogging. Control + 0 nM EBR (a), waterlloging + 0 nM EBR (b), control + 5 nM EBR (c), waterlloging + 5 nM EBR (d), control + 10 nM EBR (e), waterlloging + 10 nM EBR (f). Legends: RE = Root epidermis; RC = Root cortex; RD = Root endodermis; VC = Vascular cylinder; RM = Root metaxylem; EAd = adaxial epidermis; EAb = Adaxial epidermis; PP = Palisade parenchyma; SP = Spongy parenchyma. Black bars = 500 µm and gray bars = 200 µm
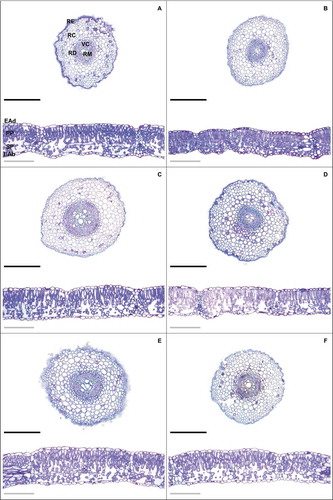
Table 2. Photosynthetic pigments, chlorophyll fluorescence and gas exchange in soybean plants treated with EBR and subjected to waterlogging
Figure 2. Minimal fluorescence yield of the dark-adapted state (F0), maximal fluorescence yield of the dark-adapted state (Fm), variable fluorescence (Fv) and maximal quantum yield of PSII photochemistry (Fv/Fm) in soybean plants treated with EBR and subjected to waterlogging. Columns with different uppercase letters between EBR levels (0, 5 and 10 nM EBR under equal water condition) and lowercase letters between water conditions (control and waterlogging under equal EBR concentration) indicate significant differences from the Scott-Knott test (P < .05). Columns corresponding to means from five repetitions and standard deviations
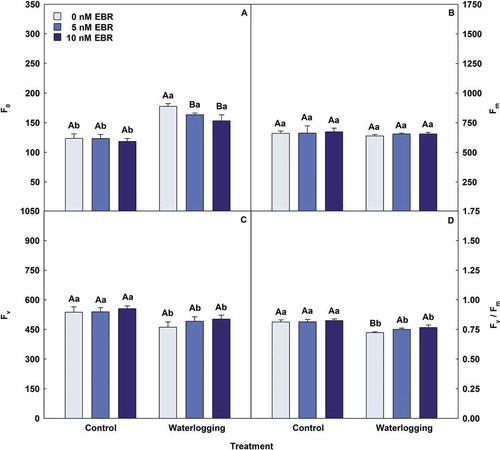
Table 3. Stomatal characteristics in soybean plants treated with EBR and subjected to waterlogging
Figure 3. Activities of superoxide dismutase (SOD), catalase (CAT), ascorbate peroxidase (APX) and peroxidase (POX) in soybean plants treated with EBR and subjected to waterlogging. Columns with different uppercase letters between EBR levels (0, 5 and 10 nM EBR under equal water condition) and lowercase letters between water conditions (control and waterlogging under equal EBR concentration) indicate significant differences from the Scott-Knott test (P < .05). Columns corresponding to means from five repetitions and standard deviations
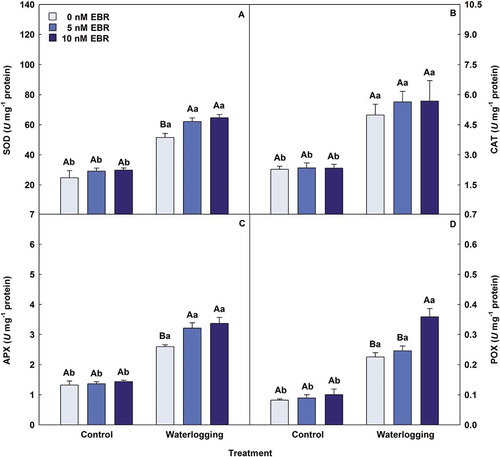
Figure 4. Superoxide (O2−), hydrogen peroxide (H2O2), malondialdehyde (MDA) and electrolyte leakage (EL) in soybean plants treated with EBR and subjected to waterlogging. Columns with different uppercase letters between EBR levels (0, 5 and 10 nM EBR under equal water condition) and lowercase letters between water conditions (control and waterlogging under equal EBR concentration) indicate significant differences from the Scott-Knott test (P < .05). Columns corresponding to means from five repetitions and standard deviations
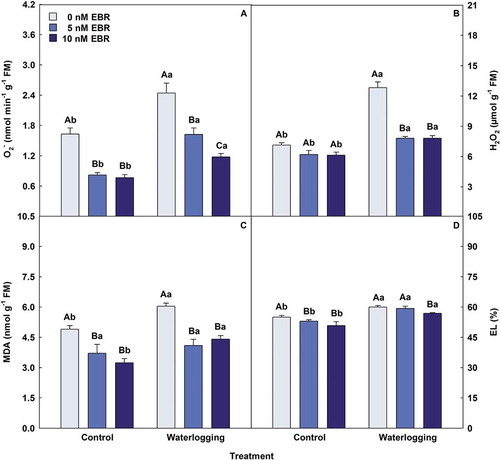
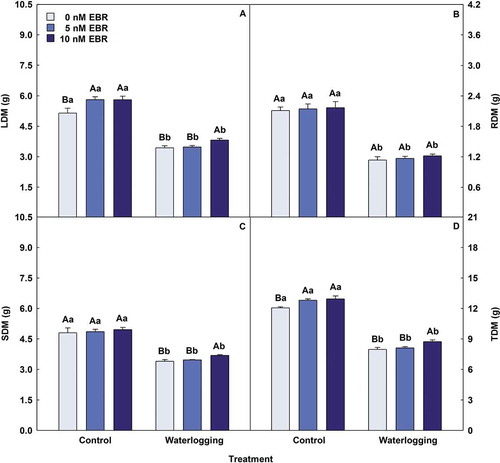
Figure 5. Leaf dry matter (LDM), root dry matter (RDM), stem dry matter (SDM) and total dry matter (TDM) in soybean plants treated with EBR and subjected to waterlogging. Columns with different uppercase letters between EBR levels (0, 5 and 10 nM EBR under equal water condition) and lowercase letters between water conditions (control and waterlogging under equal EBR concentration) indicate significant differences from the Scott-Knott test (P < .05). Columns corresponding to means from five repetitions and standard deviations
Data availability statement
Data are available upon request to the corresponding author.