Figures & data
Figure 1. Organ-specific expression pattern of rice CRK genes. (a) Expression levels based on relative band intensity of CRK genes in different tissue of rice. (b) Heatmap analysis of CRK genes in different tissue. This figure combines a “heatmap” with a dendrogram. The rows represent genes while the type of tissues is shown in the columns. The expression levels are mapped on the color scale with low, intermediate, and high expression represented by green, red, and black color respectively
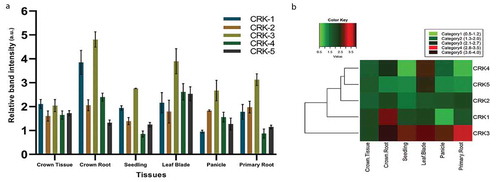
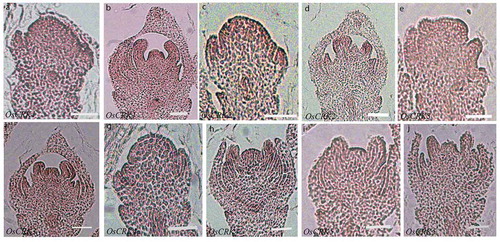
Figure 2. Spatial expression pattern of CRK genes during rice crown root primordia development. (aj) Tissue-specific expression pattern of OsCRK1 (a,b), OsCRK2 (c,d), OsCRK3 (e,f), OsCRK4 (g,h), and OsCRK5 (i,j) during CRP development, hybridized with anti-sense DIG-RNA probe. Bars: 20 µm
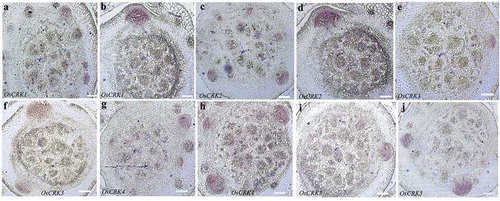
Figure 3. Spatial expression pattern of CRK genes during rice floret development