Figures & data
Figure 1. Expression analysis of stress responsive genes in shoot tissues from AtICE1 overexpression transgenic lines. Total RNA was isolated from 25 days old seedlings were treated with PEG6000 (20%), NaCl (200 mM) and Cold (4°C) for 8 h was used for gene expression analysis. (a) AtICE1 expression in transgenic lines. (b) Expression of native OsICE1 in WT and Transgenic plants. (c-h) Expression of ICE1 target genes and stress responsive genes. The series legends are same for B-H. The experiment were performed with three biological replicates (n = 3). Error bar indicates ±SE. Statistical differences are shown on the bars by labeling significantly different groups with different letters (P < .05)
Figure 2. Cold stress tolerance of AtICE1 overexpressing transgenic rice (T2) lines. (a) Photograph of rice seedling before cold stress (control), at the end of cold stress 6°C for 48 h and one week after recovery. (b–d) Graph shows Membrane stability, MDA, and H2O2 content under cold stress. (e) Survival rate of seedlings at the end of recovery period. Graph shown the mean value from three biological replicates (n = 3). Error bar indicates ±SE. *means P < .05
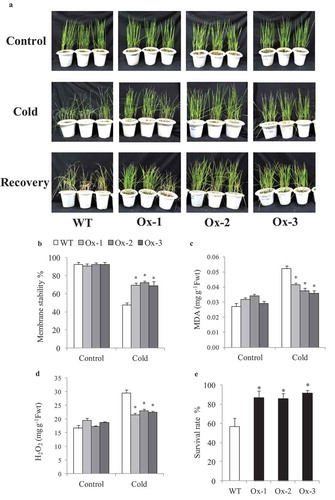
Figure 3. Evaluation for cold stress tolerance in overexpressing AtICE1 overexpression transgenic rice (T3 generation) at reproductive stage. (a) Response under cold stress for 15°C for 48 hrs and 8°C for 72 hrs and recovered at 32°C in greenhouse. (b,c) Quantum yield (Fv/FM), membrane stability were recorded under cold stress. (d,e) Grain yield and harvest index at maturity after cold stress recovery in AtICE1 overexpression lines and WT plants. The experiment was performed with three biological replicates (n = 3). Error bar indicates ±SE. *means P < .05
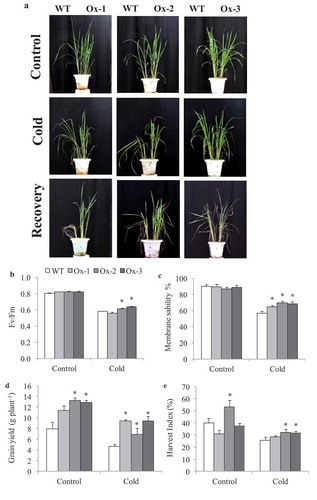
Figure 4. Evaluation of overexpressing AtICE1 transgenic rice (T2) under salt stress at reproductive stage. (a) Photograph showing phenotype of plant before and after stress and recovery in AtICE1 transgenic and WT plants. (b,c) Comparative analysis of membrane stability, chlorophyll content under stress. (d–f) Spikelet sterility, grain yield and harvest index after maturity. The experiment was performed with three biological replicates (n = 3). Error bar indicates ±SE. *means P < .05
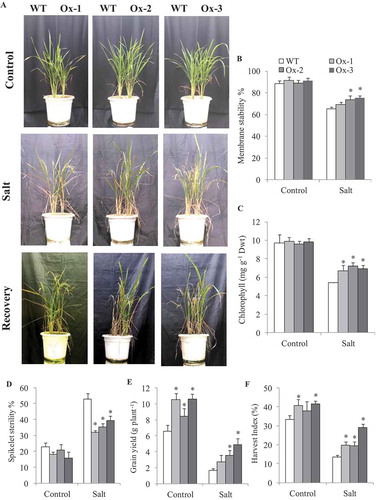
Figure 5. Evaluation of AtICE1 transgenic rice (T3) for Water use at vegetative stage. (a) Photographs were captured at control, drought and recovery after 21 days. (b,c) Water used per day by AtICE1 transgenic lines and WT plants under control and drought stress. (d-f) Rate of photosynthesis and stomatal conductance and WUE under control and drought stress (−50 kPa). (g,h) Grain yield and Harvest index at maturity under control and drought. The experiment was performed with three biological replicates (n = 3). Error bar indicates ±SE. One way Anova was done for test of significance with online software (opstat).*means P < .05
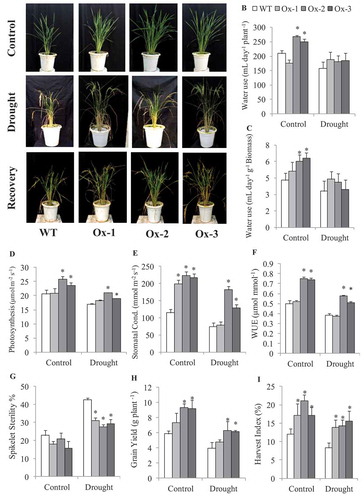
Figure 6. Overexpression of AtICE1 improved yield under nonstress conditions. (a) Response of AtICE1 transgenic and WT plants under non stress condition. (b) Yield data from control plants of three independent experiments (cold, salt, and drought) conducted at different time of the year were pooled analyzed. Each experiment was performed with six biological replicates (n = 18). Error bar indicates ±SE. *means P < .05. *means P < .05
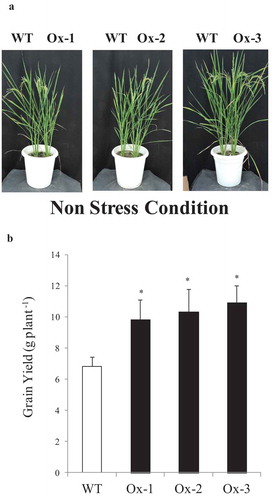
Figure 7. Stomatal density in AtICE1 overexpressing transgenic rice (T2) under control condition. (a) Image of abaxial leaf surface from fully expanded leaves under microscope (40x). (b) Stomatal density under control condition. (c-i) qRT-PCR expression analysis of genes for stomatal development. RNA was extracted from newly emerging leaves under control condition. The experiment was performed with three biological replicates (n = 3). Error bar indicates ±SE. *means P < .05. Column with different letters shows significant differences * P < .05
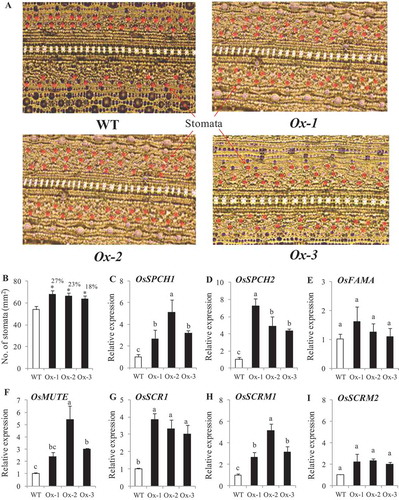
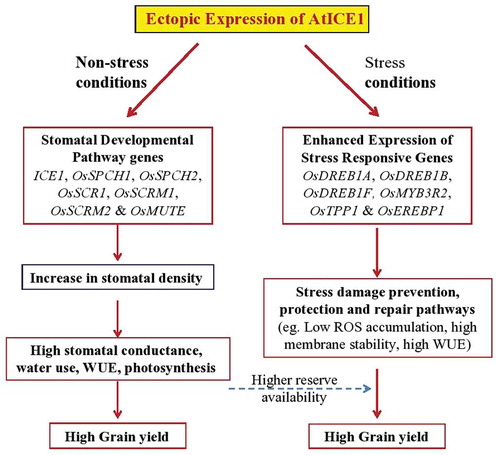
Figure 8. Probable pathways of yield improvement and stress tolerance of AtICE1 transgenic rice lines