Figures & data
Figure 1. Sequence analysis of rice AChE and PChE. (a) Chromosomal locations of rice AChE and PChE. Rice AChE and PChE are located on chromosome 7 and designated as Os07g0586200 and Os07g0586100, respectively. (b) Alignment of the amino acid sequences of rice AChE and PChE. The black box shows conserved amino acids. The gray box indicates nonidentical but functionally conserved amino acids. The conserved sequences in the GDSL enzyme family are indicated by boxes (dashed lines, Blocks I–VCitation25–27). Arrowheads indicate the amino acid residues related to the putative catalytic triad in the GDSL family enzymes. The GenBank accession numbers used in the analysis are as follows: rice AChE: AK073754; rice PChE: AK071404. (c) Prediction of signal peptide cleavage site of rice PChE using SignalP5.0. The three kinds of possibilities are reported on the plot, namely, Sec/SPI (secretion signal peptide), CS (cleavage site), and OTHER (probability that the sequence does not have any kind of signal peptide)
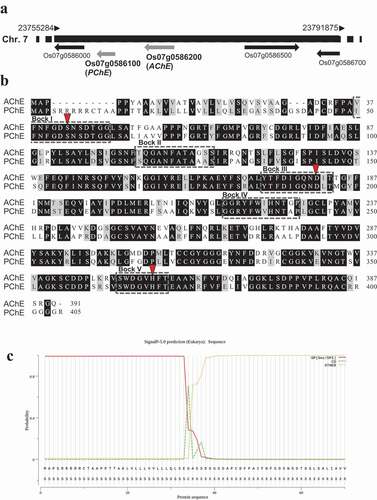
Figure 2. Phylogenetic tree derived from the analysis of amino acid sequences of the cholinesterase genes in various organisms. The scale bar indicates the number of amino acid substitutions. GenBank accession numbers used in the analysis are as follows: Drosophila melanogaster AChE, X05893; Electrophorus electricus AChE, AF030422; Danio rerio AChE, NM_131846; Homo sapiens AChE, M55040; Homo sapiens BChE, NM_000055; Bos taurus BChE, NM_001076906; Rattus norvegicus BChE, AF244349; Pseudomonas aeruginosa AChE, KF981438; Macroptilium atropurpureum AChE, AB294246; Salicornia europaea AChE, AB489863; Gossypium hirsutum alpha-L-fucosidase 3-like protein, XM_016837348; Glycine max GDSL esterase/lipase, XM_003554018; Oryza sativa PChE, AK071404; Triticum aestivum predicted protein, AK451334; Hordeum vulgare predicted protein, AK366643; Zea mays AChE, AB093208; Oryza sativa AChE, AK073754
Figure 3. Generation of transgenic rice with altered expression of PChE gene (a) ChE activity in two different transformants overexpressing PChE. The values are presented as means ± SE of three replicates. The results were analyzed using Student’s t-test; asterisk indicates p values <.01, that is, these are considered significantly different from the wild-type. (b) RT-PCR analysis of PChE mRNA expression in transgenic (pUbi::PChE No. 9 and No. 18) and wild-type rice. The left side of each panel designates the primers used; AChE: acetylcholinesterase gene; PChE: propionylcholinesterase gene; UBQ: ubiquitin-encoding gene as an internal control. (c) Typical phenotypes of 14-day-old transgenic rice plants (T2 generation) overexpressing the rice PChE. (d) ChE activity of transgenic (PChE-KD No. 9 and No. 11) and wild-type rice plants measured using Ellman’s reagent with ASCh as the substrate as described in the Materials and methods section. The values are presented as means ± SE of three replicates. The results were analyzed using Student’s t-test; asterisk indicates p values <.01, that is, these are considered significantly different from the wild-type. (e) RT-PCR analysis of PChE mRNA expression in transgenic (PChE-KD No. 9 and No. 11) and wild-type rice. The left side of each panel designates the primers used; AChE: acetylcholinesterase; PChE: propionylcholinesterase gene; UBQ: ubiquitin-encoding gene as an internal control. (f) Typical phenotypes of 14-day-old transgenic rice plants (T2 generation) with suppressed expression of the rice PChE.
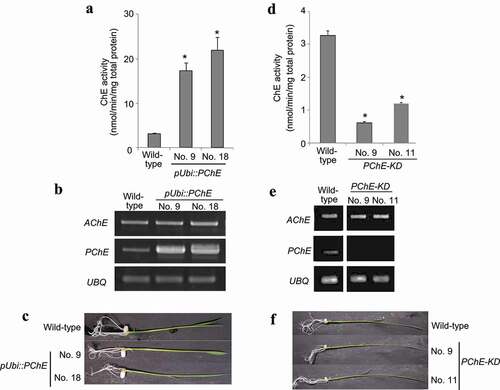
Figure 4. Enzymatic characterization of rice PChE
Figure 5. Molecular characterization of rice PChE (a) Immunoblotting analysis of total protein isolated from transgenic (pUbi::PChE No. 9 and No. 18) and wild-type rice. The upper panel exhibits immunoblotting analysis with anti-maize AChE as probe. The lower panel shows loading control stained with Ponceau S to confirm equal loading of samples. (b) Estimation of the molecular mass of the active form of rice PChE using gel filtration chromatography. X-axis represents the ratio of void volume and elution volume (Ve/Vo) and Y-axis represents the log molecular mass (kDa). The closed circle shows molecular mass of the active form of rice PChE. The open squares show a series of marker proteins: ferritin (440 kDa); aldorose (158 kDa); conalbumin (75 kDa); ovalbumin (43 kDa); carbonic anhydrase (29 kDa); Ribonuclease A (13.7 kDa); Aprotinin (6.5 kDa). (c) Elution profile of active form-AChE (line, left Y-axis) and PChE (dotted line, right Y-axis) on a Superdex 200 Increase 10/300 GL column. X-axis represents the elution volume (mL). Y-axis shows ChE activity as the absorbance at 412 nm
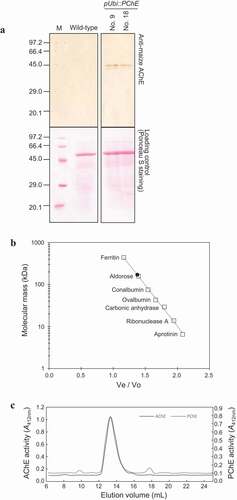
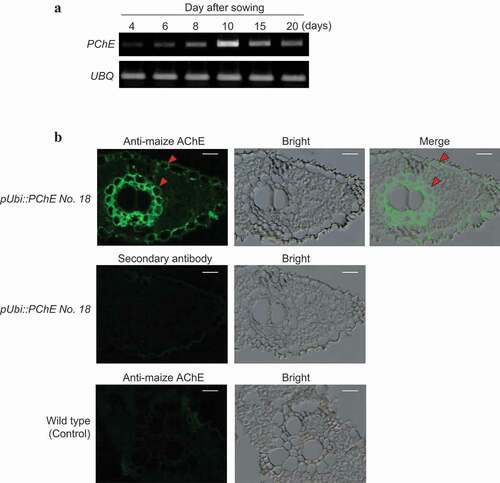
Figure 6. Expression profile and subcellular localization of PChE (a) Expression profile of PChE was investigated by semiquantitative RT-PCR analysis using total RNA extracted 4, 6, 8, 10, 15, and 20 days after sowing. The left side of each panel designates the primers used: PChE (propionylcholinesterase gene); UBQ (ubiquitin-encoding gene) as an internal control (Supplementary Table 1). (b) Subcellular localization of PChE was performed by immunofluorescence methods. The left side of each panel designates the plant specimen. The cross sections (6 μm thickness) of leaves of PChE-overexpressing rice (T2 generation) were labeled using maize AChE antibody as described in the “Materials and methods section” (upper panels). For the secondary antibody control, the sections were stained using only Alexa Fluor 488-conjugated anti-rabbit IgG without addition of the primary antibody (a center left panel). The sections obtained from wild-type plants were used as controls (lower panels). The arrowheads indicate the points of PChE localization. Each scale bar represents 10 μm. The left, middle, and right panels show fluorescent, bright field, and merged images, respectively