Figures & data
Figure 1. Growth pattern and herbivory in silver-leaf nightshade, Solanum elaeagnifolium. (a) plants before flowering, (b) mature fruits, (c) leaf damage, and (d) flower damage
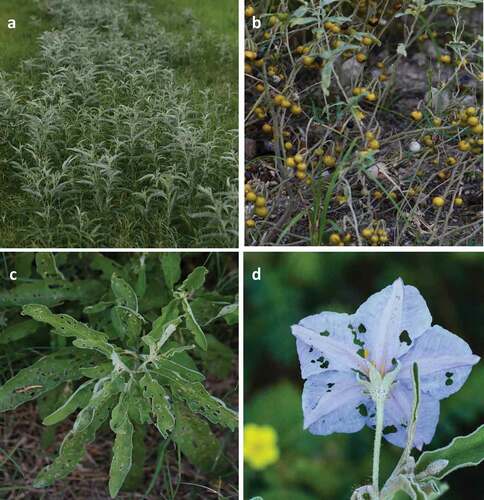
Figure 2. Map showing the sampling locations for the 50 subpopulations included in this study (black dots), their respective counties and the different soil types in that county. The survey area included 11 Texas counties and covered about 36,000 km2
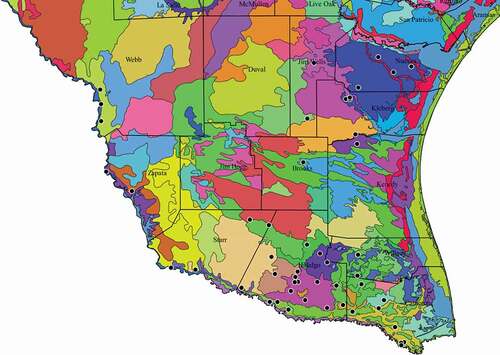
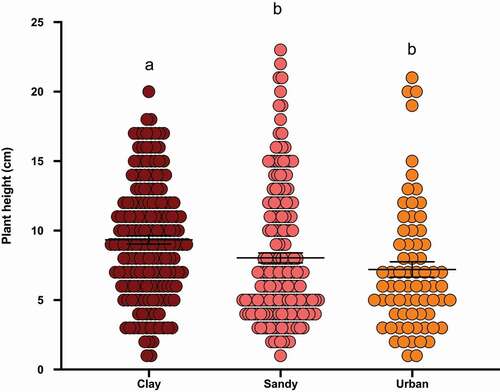
Figure 3. Results from our survey indicate that soil type had a significant effect on Solanum elaeagnifolium height (One-way Anova; F = 7.06; P = .001). Significant differences are based on post hoc Tukey tests represented by lowercase alphabetical letters at P < .05. The X-axis represents soil type and Y- axis plant height (cm)