Figures & data
Figure 1. Glucosinolate turnover occurs in vivo without tissue disruption. (a) A schematic diagram of PAOx metabolism and benzyl glucosinolate degradation into benzyl isothiocyanate in Arabidopsis thaliana. In addition to the shown pathways, PAOx can also act as a precursor for PAA. (b) Benzyl glucosinolate, (c) PAA, (d) benzyl isothiocyanate, and (e) benzyl cyanide content of WT, ref2, and CYP79A2 overexpression lines. All metabolite data was collected from 2-week-old whole seedlings grown on MS plates. Benzyl glucosinolate content was determined via HPLC, while all other metabolites were analyzed via GC-MS. Data represents mean ± SD (n = 3). The means were compared by one-way ANOVA and statistically significant differences (P < .05) were identified by Tukey’s test and are indicated by letters to represent differences among groups. (f) Expression levels (log2 fold change) of myrosinase and β-glucosidase genes in CYP79A2 overexpression line ox-2 compared with wild-type. TGG3, 4, 5, and 6 were not expressed in our samples. Expression levels were calculated using published RNAseq data (PRJNA682862).Citation5
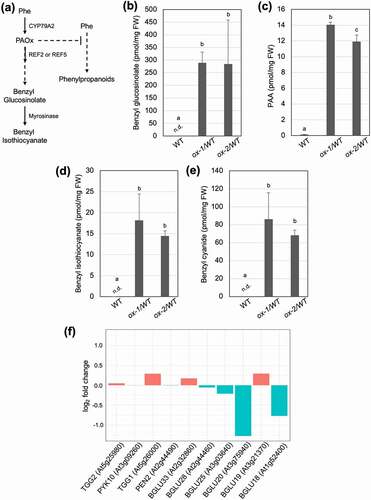
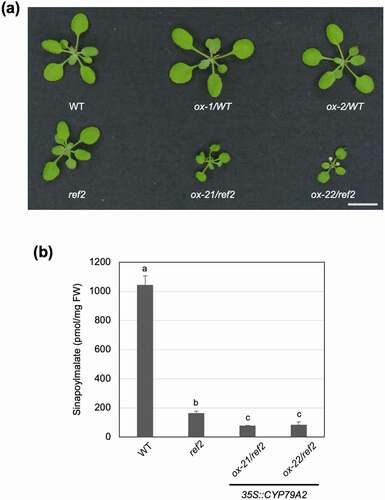
Figure 2. Aldoxime-derived repression of phenylpropanoid biosynthesis is additive. (a) Representative 2-week-old CYP79A2 overexpression lines in the WT and ref2 genetic backgrounds compared with their controls. Bar, 1 cm. (b) Sinapoylmalate content of WT, ref2, and CYP79A/ref2 overexpression lines (ox-21, ox-22). Sinapoylmalate in 2-week-old whole aerial parts was analyzed via HPLC. Data represents mean ± SD (n = 4). The means were compared by one-way ANOVA and statistically significant differences (P < .05) were identified by Tukey’s test and indicated by letters to represent differences among groups