Figures & data
Figure 1. Phenotypes characterization of the WT and ZmWRKY114-overexpressing plants. (a) WT and ZmWRKY114-overexpressing plants at the heading stage. Bars = 20 cm. (b) Plant height at heading stage. Data are mean ± SD from at least 10 plants. (c) Flag leaves, panicles and internode phenotypes of WT and transgenic plants. fl., flag leaf; P, panicle, I to Ⅳ indicate internodes from top to bottom. Bar, 5 cm. (d) Panicle and internode lengths of WT and transgenic plants. Values are means ± SD of 15 plants. (e) Longitudinal view of parenchyma cells in penultimate internodes of WT and transgenic plants. Bar, 50 μm. (f-h) cell numbers, Cell lengths and cell widths of penultimate internodes in WT and transgenic plants. Values are means ± SD (n = 3). Significant difference was checked by Student’s t-test (* P < .05, **P < .01)
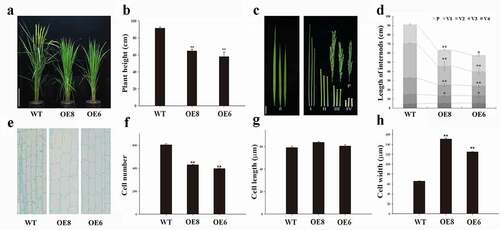
Figure 2. Effects of GA3 on plant height development of ZmWRKY114 transgenic plants. (a) The phenotype of seedlings treated with different concentrations of GA3 and 200 μM PAC. (b and c) Comparison of plant height and root length between WT and two transgenic lines. Data are means ± SD from 30 seedlings. (d) WT and two transgenic lines seedlings aged 4 weeks before GA3 treatment. (e) WT and two transgenic line seedlings were sprayed with 20 mL water for 30 days. (f) WT seedings were sprayed with 20 mL water while two transgenic line seedlings were sprayed with 20 ml 10 μM GA3 for 30 days. Bar, 3.5 cm. (g) Measurement of plant height before and after GA3 treatment. Data are mean ± SD from 15 plants. DAT, day(s) after treatment. (h) GA contents of the 4-week-old seedlings of WT and transgenic plants. Data are means ± SD from two biological samples. Asterisks mean a signifiant difference between WT plants and different transgenic lines by Student’ t-test, * P < .05, **P < .01
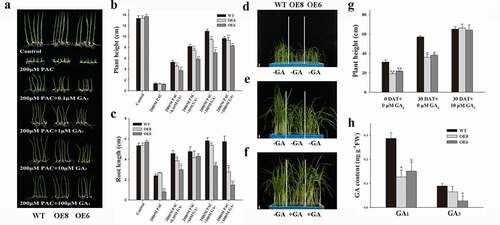
Table 1. Plant height related genes altered in two transgenic lines compared to WT plants
Figure 3. Venn diagram and qRT-PCR analyses. (a) Overlapping of up-regulated genes. (b) Overlapping of down-regulated genes. The overlap of genes that were up- or down-regulated in the different comparisons. (c) qRT-PCR analyses of expression of plant height related genes including OsGA2ox4 (AK107211), OsYAB1 (NM_001065472), OsGhd2 (XM_015767173), OsEUI1 (AK109526) and OsJar3 (NM_001062995) in WT and two transgenic lines. OsActin gene was used as an internal control. Data indicate mean ± SD of three replicates. Asterisks mean a signifiant difference by Student’ t-test, * P < .05, **P < .01
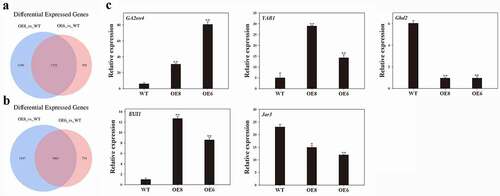
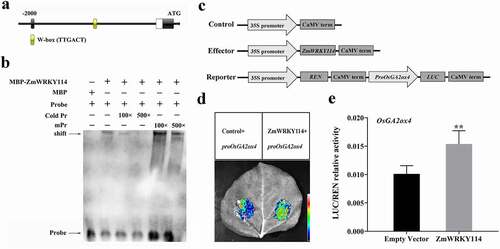
Figure 4. EMSA analysis showing binding of recombinant ZmWRKY114 protein to the promoter of OsGA2ox4. (a) The W-box was predicted in the promoter region of OsGA2ox4. (b) The black arrow indicates the binding of ZmWRKY114 and the biotin-labeled W-box probe. Pr: TTGACTTTGACTTTGACT; mPr: TTTACTTTTACTTTTACT. The + and − signs represent the presence and absence of corresponding components, respectively. (c) Schematic diagrams of the effector and reporter constructs for dual luciferase assay. REN, Renilla luciferase; LUC, firefly luciferase. (d) Luciferase assay of the OsGA2ox4 promoter. proOsGA2ox4::LUC reporter constructs were transiently expressed in leaves of N.benthamiana together with either the empty vector or 35S::ZmWRKY114 effector, and the LUC signal was imaged at 72 h post-transfection. (e) The LUC/REN ratio as determined using a dual luciferase assay. Data are means (±SD) of at least three biological replicates. Statistical significance was determined using Student’s t-test: **P < .01