Figures & data
Figure 1. Leaf shapes in Boquila trifoliolata. (a) Non-mimic leaf, with three lobes, dense vascular network. (b) Mimic leaf, with a single lobe in the apex, less dense vascular network. Red asterisks shows examples of free-ending veinlets.
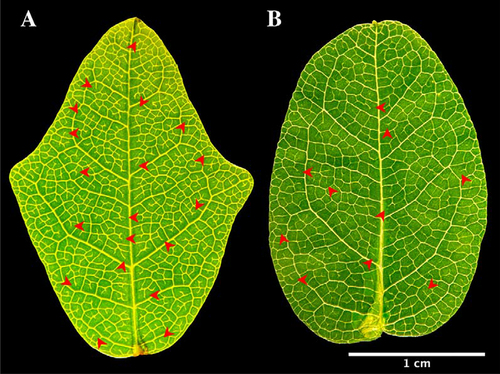
Figure 2. Experimental design. Four Boquila trifoliolata plants lined up side-by-side in front of a window and the artificial model vine plant with plastic leaves (red). Leaves below shelf 1 is the non-mimic (control) leaves. Leaves above shelf 1 is the mimick leaves. Created with BioRender.com.
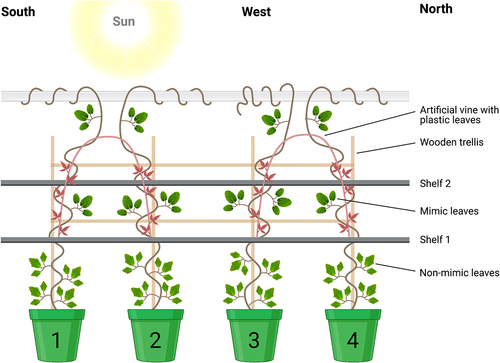
Figure 3. Single lobe mimic leaf. Mimicry attempt to the plastic leaves of artificial host plant.
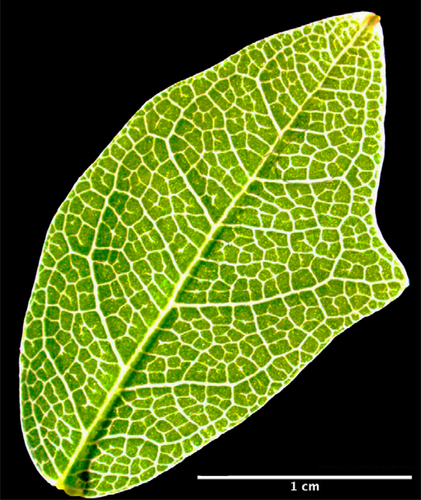
Figure 4. Plastic leaf of a model artificial plant with longitudinal shape.
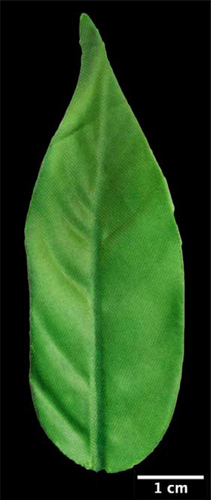
Figure 5. Morphometric analysis of Boquila trifoliolata leaves. Black bars correspond to non-mimic leaves (control), without contact with plastic leave. Gray bars correspond to mimic leaves, with close contact with plastic leaves. Leaves were classify into young, middle and old regarding their age. Measurements performed in 16 biological repetitions and two-tailed Student’s t-test was used to identify significant differences between mimick and non-mimic leaves. P-values<0.05 were considered significant (***P < .001; **P < .01; *P < .05). The error bars reported in all graphs represent standard deviation.
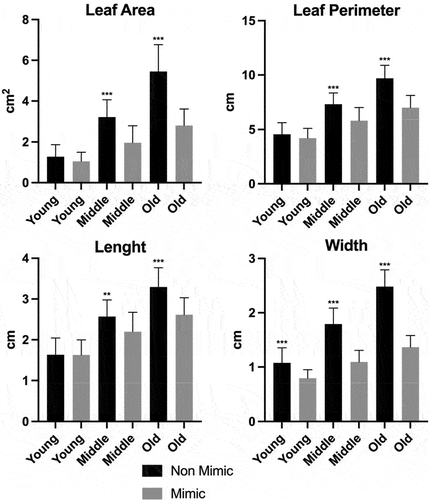
Figure 6. Morphometric analysis of Boquila trifoliolata leaves. Aspect ratio is the ratio of leaf length and width. Circularity describes the difference between a leaf and a circle. Rectangularity describes the similarity between a leaf and a rectangle. Form factor is the ratio between leaf width and length. Measurements performed in 16 biological repetitions and two-tailed Student’s t-test was used to identify significant differences between mimick and non-mimic leaves. P-values<0.05 were considered significant (***P < .001; **P < .01; *P < .05). The error bars reported in all graphs represent standard deviation.
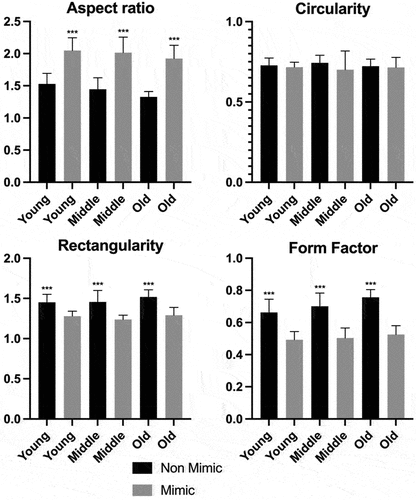
Figure 7. Quantification of the free-ending veinlets. Number of free-ending veinlets per leaf. Black bars correspond to non-mimic leaves (control), without contact with plastic leave. Gray bars correspond to mimic leaves, with close contact with plastic leaves. Leaves were classify into young, middle and old regarding their age. Measurements performed in 4 biological repetitions and two-tailed Student’s t-test was used to identify significant differences between mimick and non-mimic leaves. P-values<0.05 were considered significant (***P < .001; **P < .01; *P < .05). The error bars reported in all graphs represent standard deviation.
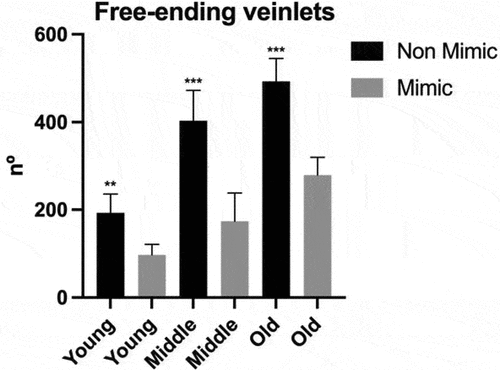
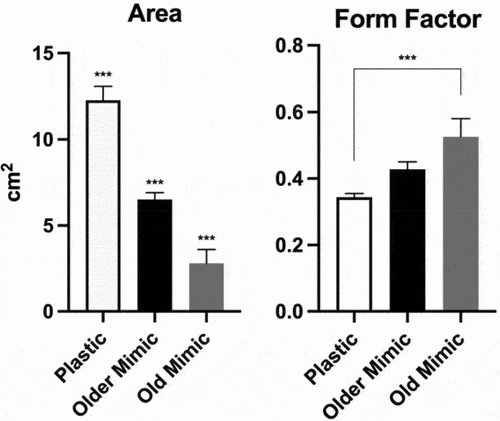
Figure 8. Leaf area and form factor (ratio between leaf width and length) of plastic leaves, old mimic leaves and older mimic leaves (leaves one year older). All three groups showed significant differences in leaf area. Only the plastic and old mimic groups showed a difference between each other, the other interactions showed no significant differences. The data were submitted to one-way analysis of variance (ANOVA) and the mean values were compared by Tukey test (***P < .001; **P < .01; *P < .05). The error bars reported in all graphs represent standard deviation.