
Figures & data
Figure 1. Sequence alignments of AtNIP1;2 and AtNIP5;1. Red letters define the NPA1 (in LB) and NPA2 (in LE) motifs. Blue boxed letters refer to the tetrad residues of the ar/R constriction region. Rectangle boxes above the amino-acid sequences delineate the transmembrane helices (TM). Thin lines between TMs indicate the inter-helical loops. H, helix; LA-LE, inter-helical loops A-E.
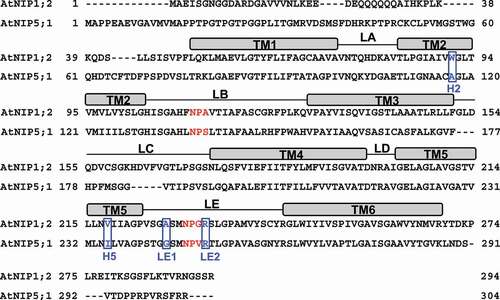
Figure 2. Mutations in the NPA motifs and ar/R selectivity filter eliminate AtNIP1;2- mediated aluminum sensitivity in yeast cells. Yeast (BY4741) lines carrying the empty vector pYES2, or constructs expressing the wild-type (WT) AtNIP1;2 (NPA/NPG/AIGR) or AtNIP1;2 mutants N111L (LPA/NPG/AIGR), N230L (NPA/LPG/AIGR), or R233G (NPA/NPG/AIGG) were subjected to Al sensitivity tests. Letters in parenthesis refer to the NPA1, NPA2, and ar/R constriction regions, respectively. Red letters indicate exchanged residues. Aliquots (5 μl) of 10-fold serial dilutions of re-suspended cells were spotted onto LPM plates (pH 4.2, 2% galactose) supplemented without (no stress) or with 100 and 200 μM AlCl3 buffered with 200 and 400 μM malate, respectively. The LPM plates were placed in a 30°C incubator for 3 d.
Figure 3. Influence of N/L substitution in the NPA motifs and R/G substitution in the ar/R selectivity filter on AtNIP1;2-mediated Al uptake. Yeast (BY4741) lines carrying the empty control (CK) vector pYES2 and expressing the native or mutated (i.e., N111L, N230L, and R233G) AtNIP1;2 were subject to short-term (2 h) Al uptake assays. Data are means ± SD (n = 3). Different letters above the columns indicate statistically significant differences at P < .05 by Tukey’s test.
Figure 4. Impacts of third residue substitutions in the NPA motifs and residue substitutions in the ar/R selectivity filter on AtNIP1;2-mediated Al uptake. Yeast (BY4741) lines carrying the control (CK) empty vector pYES2 and the native (NPA/NPG/WVAR) or mutated AtNIP1;2 were subject to short-term (2 h) Al-uptake assays. (a) Red letters indicate substitutions of the third residue in the NPA1 and NPA2 motifs. (b) Red letters indicate residue substitutions of the ar/R tetrad. Data are means ± SD (n = 3). Different letters above the columns indicate statistically significant differences among groups at P < .05 by Tukey’s test.
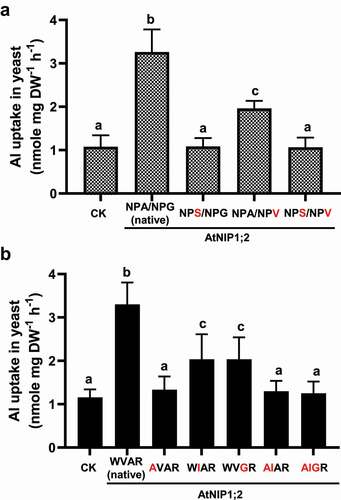
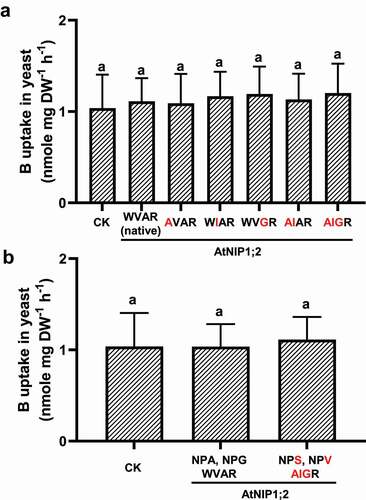
Figure 5. AtNIP5;1-like NPA motifs and ar/R selectivity filter does not render B uptake activity to AtNIP1;2. Yeast (BY4741) lines carrying the control (CK) empty vector pYES2 or expressing AtNIP1;2 containing the native or mutated NPA and ar/R constriction regions were subject to short-term (2 h) B uptake assays. (a) Red letters indicate residue substitutions in the ar/R tetrad. (b) Residue substitutions (red letters) that transform the AtNIP1;2 NPA and ar/R constriction regions to an AtNIP5;1 type. Data are means ± SD (n = 3). Different letters above the columns indicate statistically significant differences at P < .05 by Tukey’s test.
Availability of data and material
The data supporting this study’s findings are available from the corresponding author, JL, upon reasonable request.