Figures & data
Figure 1. Phylogenetic relationship of CaM/CML proteins. The phylogenetic tree of CaM/CML proteins from wheat, Arabidopsis, and rice is shown in this figure. The phylogenetic tree was generated using the maximum likelihood (ML) method in MEGA X. A bootstrap test method was adopted with 1000 replicates.
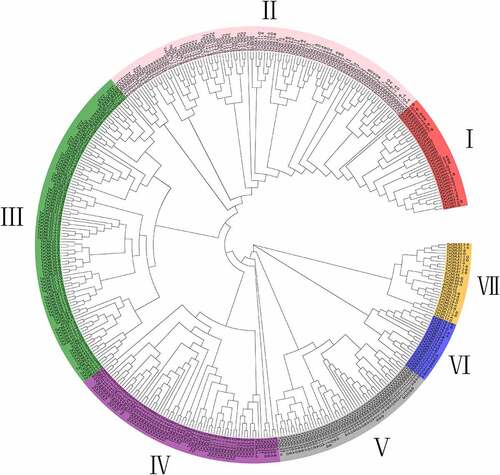
Figure 2. Chromosome locations of wheat CaM/CML genes. The chromosome numbers are shown at the left of each bar. The scale is represented in megabases (Mb).
Figure 3. Collinearity diagrams among TaCaM/CML gene members of T. aestivum, T. turgidum, and Ae. Tauschii. Orthologous CML genes mapped onto T. aestivum (chromosomes 1A–7D), T. turgidum (chromosomes 1A-7B), and Ae. Tauschii (chromosomes 1D-7D). Green lines indicate orthologous CaM/CML genes pairs.
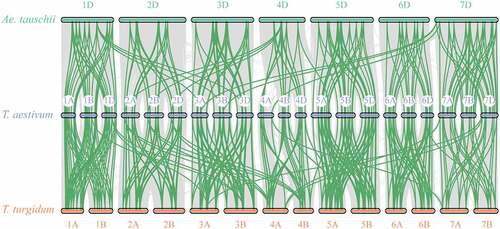
Figure 4. Numbers of TaCaM/CML transcripts containing various cis-acting elements. AuxRR-core and TGA element: auxin responsive element, CGTCA-motif: JA-responsive element, ABRE: abscisic acid (ABA)-responsive element, DRE/CRT: dehydration-responsive element/C-repeat element, G-box: environmental signal response element, LTR: low-temperature responsive element, W-box: WRKY binding site, SURE: sulfur-responsive element.
Figure 5. Spatiotemporal expression patterns of TaCaM/CML genes. The heat map illustrates the spatiotemporal expression patterns of TaCaM/CML genes in five tissues (roots, leaves, stems, spikes, and grain) in three developmental stages. A Zadoks scale represents the developmental stages. Different colors correspond to log2-transformed values. Blue or red indicates lower or higher expression levels of each transcript in each sample, respectively.
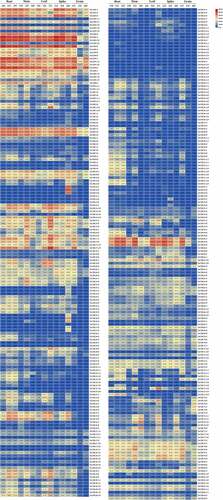
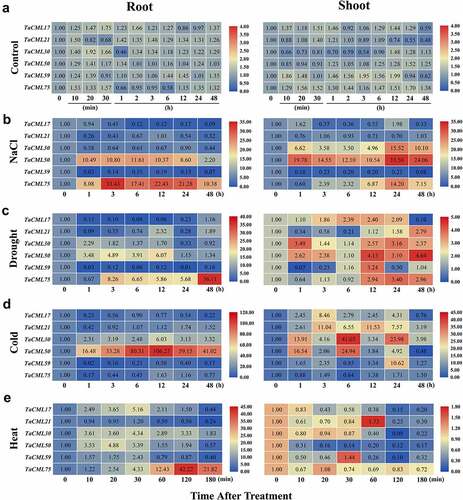
Figure 6. Relative expression levels of TaCML genes after abiotic treatment. The heatmap shows the relative expression patterns of TaCML genes in the roots and shoots after NaCl (a), drought (b), cold (c), and heat (d) treatments using qRT-PCR analysis. Different colors correspond to relative expression values. Blue or red indicates lower or higher relative abundance of each transcript in each sample, respectively.