Figures & data
Figure 1. Models of PpPIEZO1 and PpPIEZO2 predicted protein structures. (a) Diagram of a typical PIEZO monomer, based on cryo-EM structures of mPiezo1 and mPiezo2. Not drawn to scale. OH, outer helix; IH, inner helix; CTD, C-terminal domain. (b) Phyre2-generated models of PpPIEZO1 and PpPIEZO2 monomers. Helices, strands/sheets, and coils are depicted in green, yellow, and magenta, respectively. (c) Predicted models of PpPIEZO1 and PpPIEZO2 monomers (gray) superimposed onto one subunit of the mPiezo2 homotrimeric complex (dark blue). The other two subunits of the mPiezo2 complex (light blue and cyan) are shown without the overlay. Models were visualized with UCSF Chimera software.Citation12
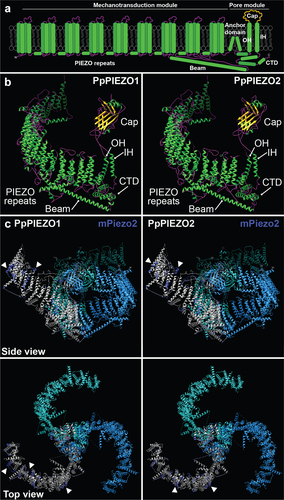
Figure 2. PpPIEZO1 and PpPIEZO2 are ubiquitously expressed in moss vegetative tissues. Relative expression of PpPIEZO1 (left) and PpPIEZO2 (right) in various moss vegetative tissues. Ct values were normalized to the geometric mean of two housekeeping genes (Pp3c8_16590 and Pp3c14_7550). Datapoints shown are from three biological replicates, three technical replicates each (except for PpPIEZO1 protonema, where one outlier technical triplicate was removed from the second biological replicate). Bars, average values. Statistics, one-way ANOVA with Post-Hoc Tukey’s test (p < .05). Letters denote grouping based on statistical differences.
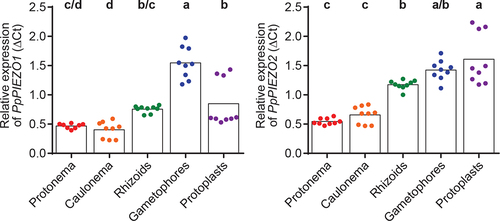
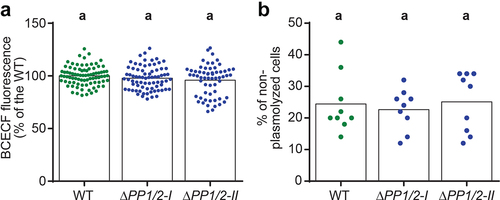
Figure 3. PpPIEZO1/2 mutants have normal vacuolar pH and intracellular osmotic potential. (a) Ratio of BCECF fluorescence after excitation with 488 and 445 nm light. Datapoints shown are individual cells from six experiments, each normalized to their respective WT average (N = 84, 75, and 61 cells for WT, ΔPP1/2-I, and ΔPP1/2-II, respectively). Statistics, Kruskal-Wallis test with Dunn’s multiple comparisons test (P < .05). (b) Percentage of non-plasmolyzed apical caulonemal calls after 5 min exposure to BCDAT media supplemented with 350 mM mannitol. Datapoints shown are from three independent experiments. Each data point corresponds to the percentage calculated from 50 cells from a single plant. Bars, average values. Statistics, as in (A).