Figures & data
Figure 1. Silencing of δ‐aminolevulinic acid dehydratase via Citrus tristeza virus-induced gene silencing (CTV-IGS) causes callose deposition in citrus phloem tissue. Note the increased amount of callose deposits in the phloem tissue as seen in peeled stem bark is correlated with the increase in phenotype, but the highest amount is found in the moderate phenotype. Callose deposits were visualized by staining with aniline blue. Zero: control plants (CTV-wt). 1–5: degrees of phenotype in ALAD-silenced plants (CTV-tALAD-as).
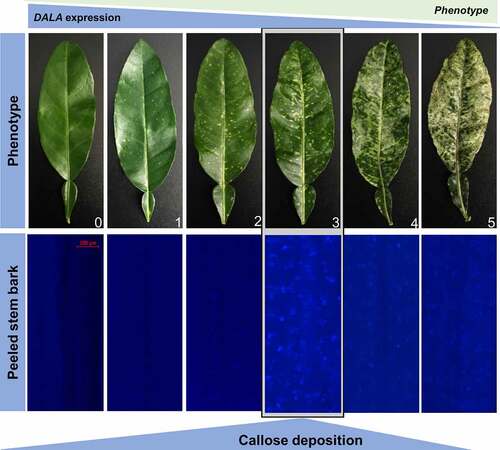
Figure 2. Visualization and quantification of callose deposits in the moderate phenotype of ALAD-silenced plants (CTV-tALAD-as) phloem tissue compared to control plants (CTV-wt). A-H: Visualization of callose deposits by staining with aniline blue. A-D: Control plants. E-H: ALAD-silenced plants. I: Total callose deposits quantified as fluorescence intensity. J: Fold change in callose synthase gene expressions performed with RT-PCR. Arrows indicate callose deposits.
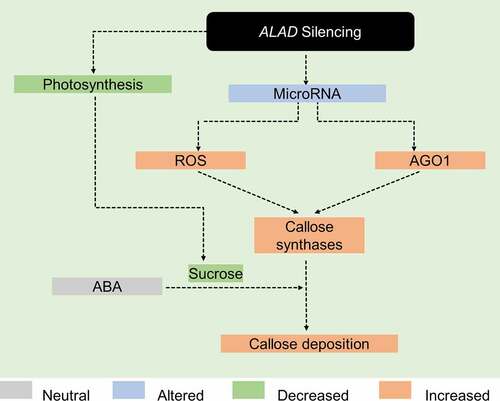
Figure 3. Proposed model on how silencing of δ‐aminolevulinic acid dehydratase leads to deposition of callose. See main text for details.