Figures & data
Figure 1. Pep1 induces callose and lignin depositions in roots and shoots. (a) Pep1 induces callose deposition in the vasculature of shoot and root. (b) Pep1 induces lignin deposition in the vasculature of shoot and root. One-week-old plate-grown seedlings of WT or pmr4 mutants were treated with H2O, 1 μM Pep1, 1 μM SCOOP12, or 1 μM flg22 for 24 hours, followed by callose (A) or lignin staining (B). At least ten seedlings for each treatment were detected with similar results. Bar = 200 μm. All experiments were repeated three times with similar results.
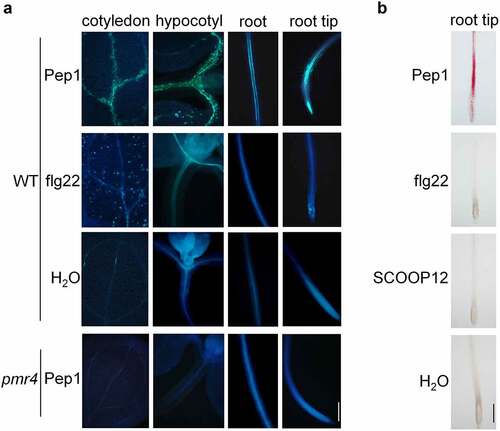
Figure 2. Pep1-induced callose and lignin deposition relies on PEPR1/2, BAK1/SERK4, BIK1/PBL1 and AGB1. (a and b) Pep1 induces callose and lignin depositions through PEPR1/2, BAK1/SERK4, and BIK1/PBL1. (c and d) PEPR2 plays a major role in the Pep1-induced lignin disposition. (e and f) Pep1, Pep2, but not Pep3 induce lignin disposition in root tips.(g-h) Pep1 induces callose and lignin deposition through AGB1. One-week-old plate-grown seedlings of indicated genotypes were treated with H2O or 1 μM Pep1 for 24 hours, followed by callose or lignin staining. Quantification data of callose and lignin in b, d, f, and h were indicated as means of intensity unit from each repeat. Significant differences were shown by different letters (Student’s t-test, n ≥ 8). The experiment was repeated three times with similar results. Bar = 200 μm.
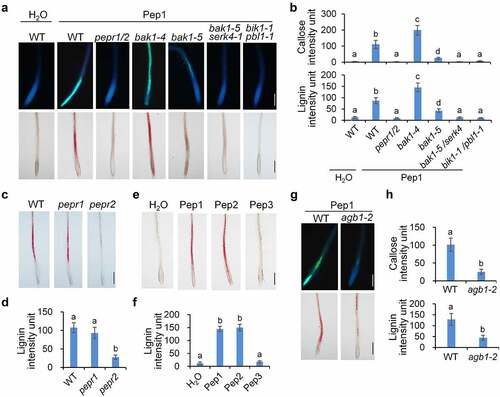
Figure 3. ROS and calcium are required for Pep1-induced callose and lignin depositions. (a and b) Pep1 induces H2O2 production through RBOHD and RBOHF in roots. One-week-old plate-grown seedlings of indicated genotypes were treated with H2O, 1 μM Pep1, or a combination of 1 μM Pep1 and 10 μM DPI, H2O2 in root tips were detected through H2DCF-DA staining. Bars = 200 μm. (c and d) Pep1-induced callose and lignin depositions through RBOHD/F. One-week-old plate-grown seedlings of indicated genotypes were treated with 1 μM Pep1 or a combination of 1 μM Pep1 and 10 μM DPI, callose and lignin were stained post 24 hours induction. Bars = 200 μm. (e and f) Pep1-induced lignin deposition is regulated by calcium channels. One-week-old plate-grown seedlings of indicated genotypes were treated with 1 μM Pep1 or a combination of 1 μM Pep1 and 1 mM LaCl3 or 10 mM EGTA, callose or lignin were stained post 24-hour treatment. Quantification data of ROS, callose, and lignin in b, d, and f, were indicated as means of intensity unit from each repeat. Significant differences were shown by different letters (Student’s t-test, n ≥ 8). The experiment was repeated three times with similar results.
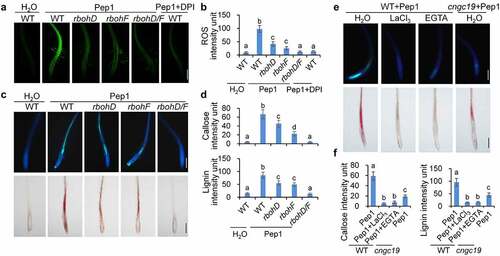
Figure 4. JA and ET oppositely regulate Pep1-induced callose and lignin depositions. (a and b) Pep1-induced callose and lignin depositions are abolished in coi1 but enhanced in ein2. One-week-old plate-grown seedlings of indicated genotypes were treated with H2O or 1 μM Pep1 for 24 hours, followed by callose or lignin staining. Bar = 200 μm. (c–e) Pep1-regulated expression of PROPEP1 (d), PEPR2 (e) and VSP2 (f) is attenuated in myc2/3/4 but enhanced in ein3/eil1. One-week-old seedlings of indicated genotypes were treated with 1 μM Pep1, mRNA was isolated for RT-qPCR analysis of gene transcription levels 3 (d and e) or 24 (f) hours post treatment. Different letters indicate a significant difference with others (P < .01, n.s., no significant differences, Student’s t-test, n = 3). (f and g) Pep1-induced H2O2 production is attenuated in coi1 but enhanced in ein2. One-week-old plate-grown seedlings were treated with 1 μM Pep1, H2O2 in root tips were detected through H2DCF-DA staining. Bar = 200 μm. Quantification data of ROS, callose, and lignin in b, d, and f were indicated as means of intensity unit from each repeat. Significant differences were shown by different letters (Student’s t-test, n ≥ 8). The experiments were repeated three times with similar results.
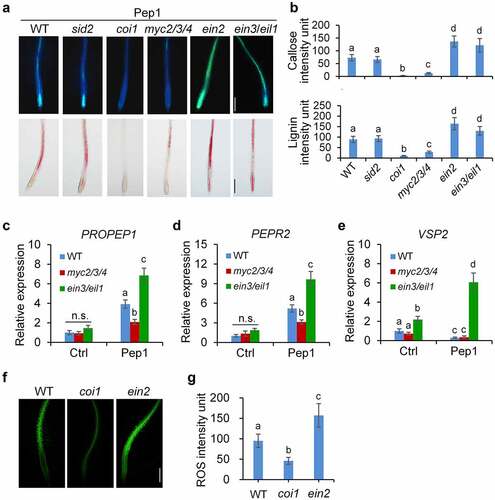
Figure 5. JA and ET signaling oppositely regulate Pep1-induced expression of genes involved in callose and lignin biosynthesis. One-week-old seedlings of indicated genotypes were treated with 1 μM Pep1, mRNA was isolated for RT-qPCR analysis of gene transcription levels 6 hours post treatment. Different letters indicate a significant difference with others (P < .01, Student’s t-test, n = 3). The experiments were repeated three times with similar results.
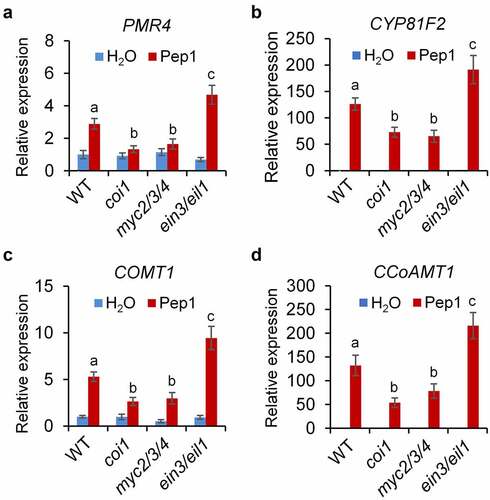
Figure 6. Pep1 triggers a systemic immune signaling from the root to the shoot. (a) A schematic diagram for the definition of local (1°) and systemic (2°) tissues. Root in the black box was treated with peptide elicitor and shoot in red box was used for gene expression analysis. (b–e) Pep1 application in roots induces systemic PR1 (b), PR5 (c), PDF1.2 (d), and PDF1.3 (e)expression in shoot. (f) Pretreatment of Pep1 in roots enhances flg22-induced callose deposition in shoots. Roots of 10-d-old plate-grown seedlings were pretreated with 1 μM Pep1 or H2O for 24 hours, then the shoot of seedlings was treated with 1 μM flg22 or H2O for another 24 hours before callose deposition staining. Callose deposits in cotyledons were measured using ImageJ. Data are shown as mean ± s.e.m (n = 8). (g) Pep1 application in roots induces PROPEP expression in roots but not in shoots. (h) Pep1 application in shoots induces PROPEP expression in shoots. (i) Pep1 application in roots induces ZAT12 expression in shoot RBOHD/F-dependent manner. (b–e, g–i) The lower half roots of 1-week-old seedlings grown on 1/2MS plate were treated with 1 μM Pep1 or H2O for 24 hours, roots were then cut off for seedlings for mRNA isolation and RT-qPCR analysis of gene transcription levels. Different letters indicate a significant difference with others (P < .01, n.s., no significant differences, Student’s t-test, n = 3). The experiments were repeated three times with similar results.
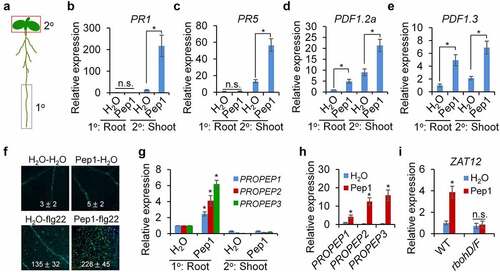
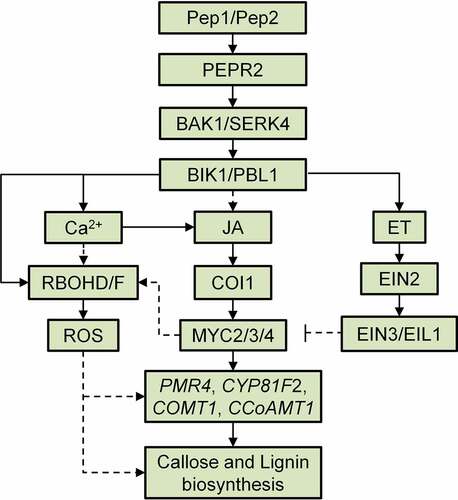
Figure 7. A proposed model of the Pep1-induced callose and lignin deposition in root. Pep1 and Pep2 are perceived by PEPR2 and transduce a signaling through BAK1/SERK4 and BIK1/PBL1, which leads to cytosolic Ca2+ increase and RBOHD/F-mediated ROS production. Ca2+ and ROS signals mediate the deposition of callose and lignin in roots. JA-COI1-MYC2/3/4 and ET-EIN2-EIN3/EIL1 signaling pathways oppositely regulate Pep1-induced ROS production and ROS-mediated callose lignin deposition. JA-COI1-MYC2/3/4-ROS may contribute to the expression of Pep and PEPR2 through a positive feedback regulation.