Figures & data
Figure 1. XopZ effector contributes to virulence of PXO99 strain on Nipponbare. (a) Pathogenic phenotypes of xopZ-related strains on Nipponbare rice leaves photographed at 14 days post-inoculation (dpi). (b) Length measurement of the blight lesions at 14 dpi. Each bar represents the mean and standard deviation (SD) of 10 rice leaves. (c) Statistics of Xoo populations in Nipponbare leaves at 14 dpi. Each bar represents the mean and SD of 5 rice leaves. In (b) and (c), different letters indicate significant differences based on Duncan’s multiple range analysis (P < 0.05). These experiments were repeated three times and similar results were obtained.
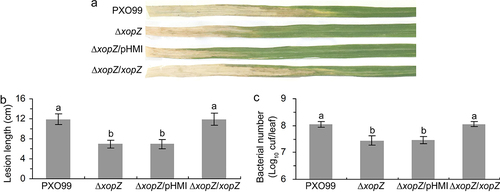
Figure 2. XopZ specifically bind to ORP1C in yeast and rice cells. (a) Y2H assay identifying the interaction between XopZ and ORP1C in yeast cells. The transformant expressing BD-53 and AD-T was used as a positive control. The transformants expressing BD-Lam and AD-T, BD-XopZ and empty AD, empty BD and AD-ORP1C were used as negative controls. (b) Co-IP assays identifying the interaction between XopZ and ORP1C in rice protoplasts. Whole-cell lysates (WCL) of rice protoplasts transformed with different plasmid combinations were prepared and analyzed by immunoblotting with marked antibodies, Co-IP was conducted with the Flag antibody (IP Flag) and the interaction was further analyzed by immunoblotting with Flag or HA antibodies.
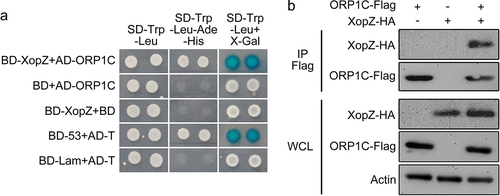
Figure 3. Identification of ORP1C mutant rice generated by the CRISPR-Cas9 gene editing system. (a) Calculation of the sgRNA target sites based on ORP1C sequence analysis. (b) Sequencing identification of ORP1C mutant rice lines. (c) Growth phenotypes of 100-day-old Nipponbare WT and ORP1C mutant rice. (d) Days to heading of different rice lines. (e) Seed setting rates of different rice lines. The seed setting rate was calculated as the ratio of fully filled seeds to the total number of grains. In (d) and (e), each bar represents the mean and SD of 5 rice plants. Different letters indicate significant differences based on Duncan’s multiple range analysis (P < 0.05). These experiments were repeated three times with similar results obtained.
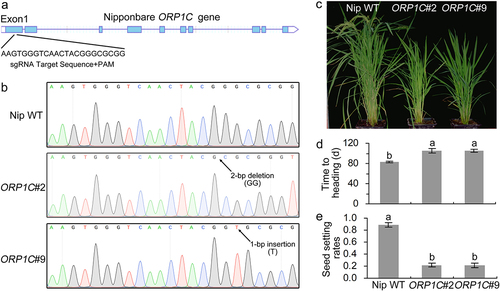
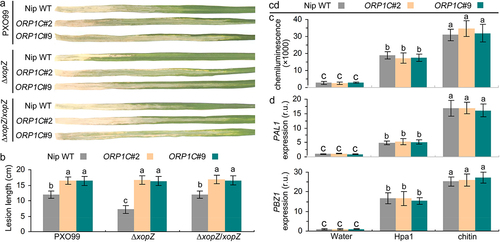
Figure 4. XopZ and ORP1C cooperate to regulate the virulence of PXO99 strain on Nipponbare not through the host PTI pathway. (a) Pathogenic phenotypes of xopZ-related strains on different rice leaves photographed at 14 dpi. (b) Length measurements of blight lesion at 14 dpi. Each bar represents the mean and SD of 10 rice leaves. These experiments were repeated three times with similar results obtained. (c) Measurement of ROS bursts in rice leaves after treatment with different elicitors. (d) Expression analyses of PAL1 and PBZ1 gene in different rice leaves after treatment with different elicitors. The average expression levels of PAL1 and PBZ1 genes in Nipponbare WT leaves treated with control water solution are defined as “1”. In (c) and (d), each bar represents the mean and SD of three biological replicates, five independent experiments were repeated with similar results obtained. In (b) to (d), different letters indicate significant differences based on Duncan’s multiple range analysis (P < 0.05).