Figures & data
Figure 1. Experiment design shows two different phases (salt stress and rewatering). ΔC indicates the change in NaCl concentration from high to low.
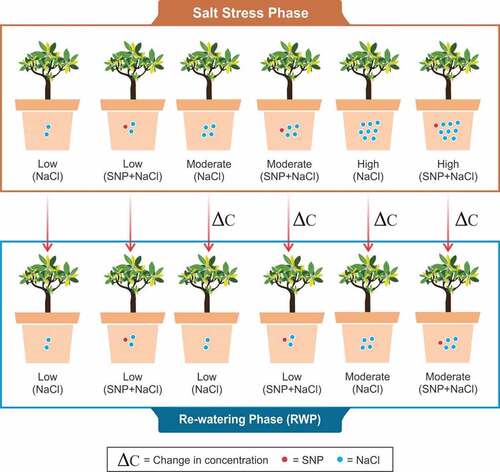
Figure 2. Simplified equivalent circuit of cells. Z = impedance, Cm = capacitance of membrane, Rm = resistance of membrane, XCm = capacitive reactance of membrane, XLm = inductive reactance of membrane, Ro = resistance outside membrane, and Ri = resistance inside membrane.
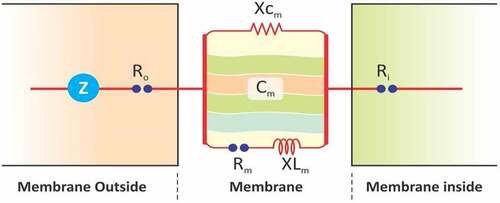
Figure 3. Representation of the parallel plate capacitor.
Figure 4. The equations of fitting curve relationship between clamping force CF and leaf resistance (R), capacitive reactance (XC), inductive reactance (XL), impedance (Z), andphysiological capacitance (C). Figure (a–e) represents the A. corniculatum species and figure (f–j) represents the K. obovate species fitting equations in stress condition (random examples).
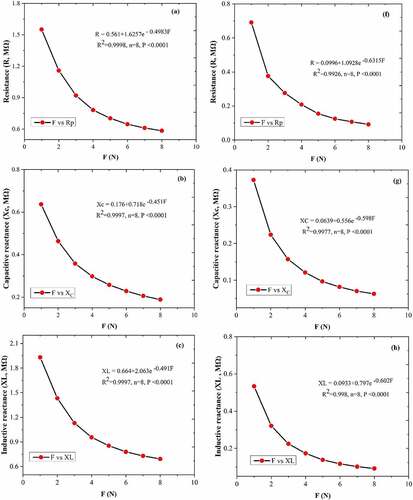
Figure 4. Continued.
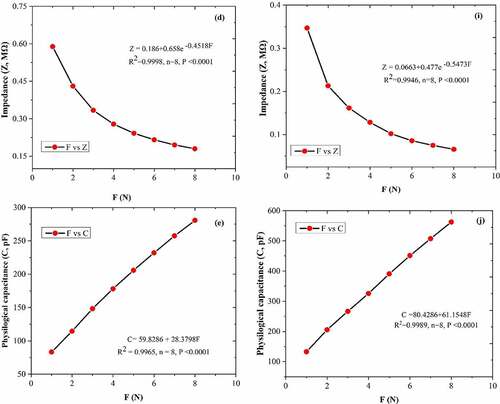
Table 1. The electrophysiological parameters of A. corniculatum species in salt stress and rewatering phase, clamping force CF = 0
Table 2. The electrophysiological parameters of K. obovate species in salt stress and rewatering phase, clamping force CF = 0
Table 3. The water utilization parameters of A. corniculatum in salt stress and rewatering phase
Table 4. The water utilization parameters of K. obovate species in salt stress and rewatering phase
Table 5. Salt transport parameters of A. corniculatum species in salt stress and rewatering phase
Table 6. Salt transport parameters of K. obovate species in salt stress and rewatering phase
Figure 5. Effect of salt stress and rewatering on water potential (Ψ): (a, c) A. corniculatum and (b, d) K. obovate. The value n = 12 and small letter indicates significant difference at (p < .05) using Duncan’s multiple range tests.
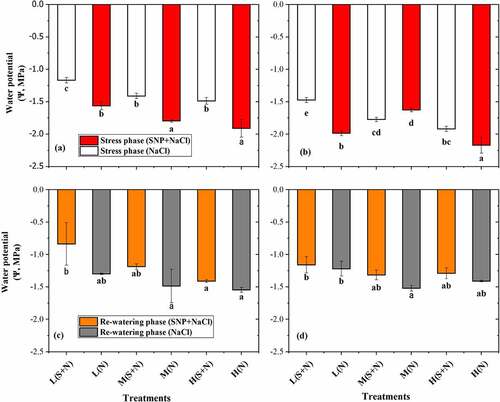
Figure 6. Effect of salt stress and rewatering on (a) net photosynthetic, (b) stomatal conductance, and (c) intercellular CO2 (Tr) transpiration of A. corniculatum. The value n = 12 and small letter indicates significant difference at (p < .05) using Duncan’s multiple range tests.
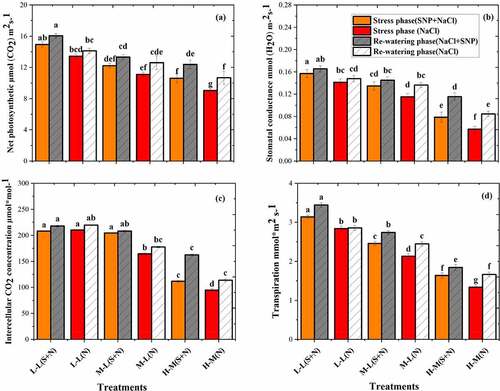
Figure 7. Effect of salt stress and rewatering on (a) net photosynthetic, (b) stomatal conductance, and (c) intercellular CO2 (Tr) transpiration of K. obovate. The value of n = 12 and small letter indicates significant difference at (p < .05) using Duncan’s multiple range tests.
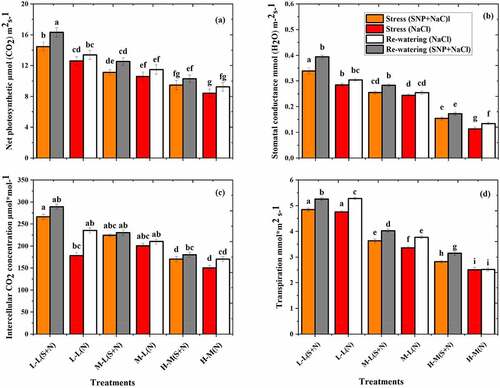
Table 7. Correlation between electrophysiological, water utilization, salt transport, and photosynthesis parameters of A. corniculatum species in salt stress and rewatering phase
Table 8. Correlation between electrophysiological, water utilization, salt transport, and photosynthesis parameters of K. obovate species in salt stress and rewatering phase
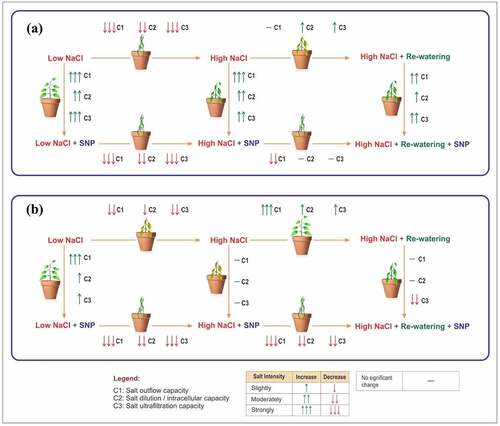
Table 9. Salt outflow capacity (C1), salt dilution capacity (C2), and salt ultrafiltration capacity (C3) of A. corniculatum in salt-stress and rewatering phase
Table 10. Salt outflow capacity (C1), salt dilution capacity (C2), and salt ultrafiltration capacity (C3) of K. obovate species in salt stress and rewatering phase
Figure 8. Hypothetical model of mangrove species in different salt level with influences of SNP and rewatering: (a) A. corniculatum and (b) K. obovate species.