Figures & data
Figure 1. Localization of SYP12 clade members in response to BFA. (a–d) Roots of plants expressing (a and c) GFP-PEN1 or (b and d) GFP-MpSYP12A and stained with FM4-64 (a and b) before and (c and d) after treatment with 50 µM BFA. (e) Roots of plants expressing both GFP-MpSYP12A and RFP-PEN1 after treatment with BFA. Bars = 10 µm. (f) Quantification of SYP12 localization in response to BFA, relative to RFP-PEN1. Signal intensities of BFA body (ROI1) and plasma membrane (PM) (ROI2), were used to calculate the BFA body/PM signal ratios. All values are mean ±SD (n = 18 cells). * indicate significantly different values at P ≤ .001 estimated using student t-test.
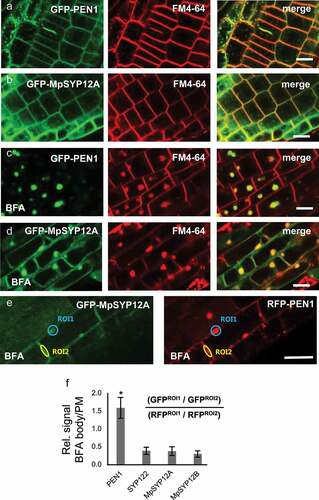
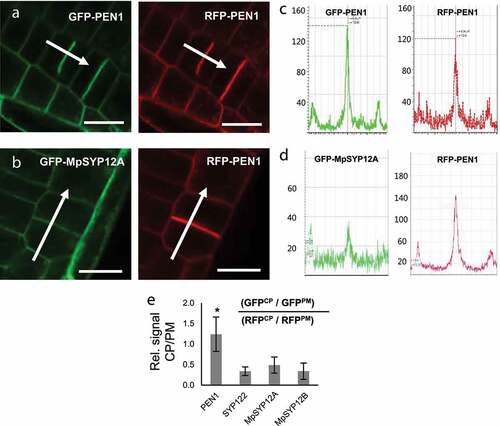
Figure 2. Localization of SYP12 clade members at the forming cell plate. (a and b) Roots of plants expressing (a) GFP-PEN1 or (b) GFP-MpSYP12A in combination with RFP-PEN1 as reference. Bars = 10 µm. (c and d) Signal intensities of GFP and RFP (from a and b, respectively) across the growing cell plate. (e) Calculated signal intensities of SYP12s at the growing cell plate relative to RFP-PEN1. Signal intensities at the growing cell plate (CP) and PM, were used to calculate the CP/PM signal ratios. All values are mean ±SD (n = 8–10 cells). * indicate significantly different values at P ≤ .001 estimated using student t-test.