Figures & data
Table 1. Features of PgWRKY genes identified in P. grandiflorus.
Figure 1. Alignment of 27 P. grandiflorus (PgWRKY) and 8 A. thaliana (AtWRKY) WRKY domain sequences. For group I WRKY proteins, N-terminal and C-terminal WRKY domains are represented by N and C, respectively. In the red solid box are WRKY domains. Zinc finger structures are marked by a red dotted box.
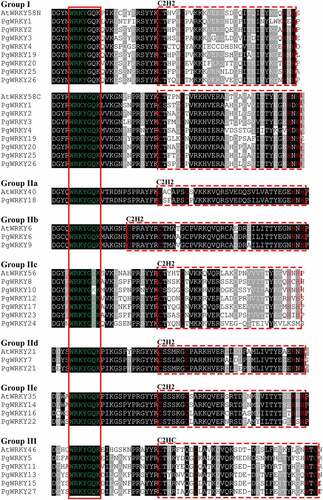
Figure 2. Conserved motif analysis of PgWRKYs. The motif composition of PgWRKY was analyzed by the MEME tool. The detailed information of the ten motifs is in Supplementary Figure 2.
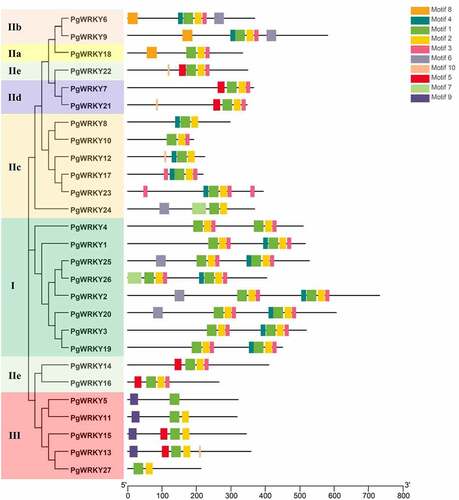
Figure 3. Phylogenetic tree of the total WRKY sequences from P. grandiflorus and A. thaliana. The WRKY sequences were used for phylogenetic analysis using the MEGA-X software. The arcs with different colors represent seven subgroups of WRKY proteins. The solid black star and hollow circle represent WRKY sequences from P. grandiflorus and A. thaliana, respectively.
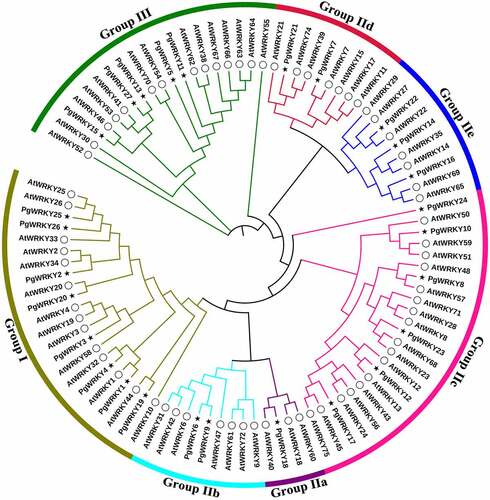
Figure 4. Expression of PgWRKY genes in P. grandiflorus tissues. (A) The heatmap of all PgWRKY genes expression in different tissues. (B) The violin plot of all PgWRKY genes expression in different tissues.
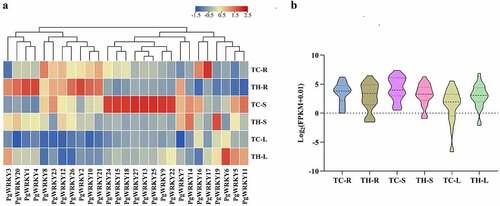
Figure 5. Saponin contents in different tissues of P. grandiflorus collected from Tongcheng southern Anhui (TC) and Taihe northern Anhui (TH) (mean ± SD, n = 3). ***Data compared with TC, P < 0.05.
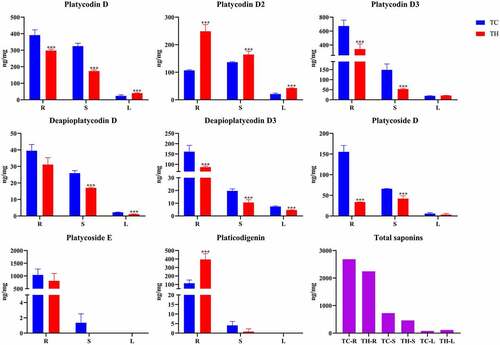
Figure 6. Expression of PgWRKY genes in response to MeJA treatment. (A) The expression of PgWRKY genes for MeJA treatments. (B) Violin plot of PgWRKY genes before and after MeJA treatment.
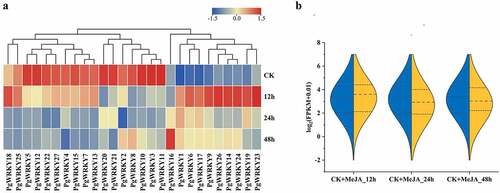
Figure 7. qRT-PCR analysis of PgWRKY genes under MeJA treatment. The Y- and X-axis represent the relative expression level and the time course of MeJA treatment, respectively. Roots were sampled at 0, 3, 6, 9, 12, 24, and 48 h after MeJA treatments. Data represent the mean ± SD of three technical repeats.
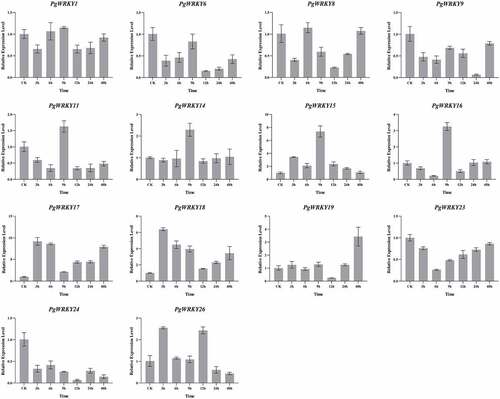
Figure 8. The Pearson’s correlation coefficients of PgWRKYs with triterpenoid biosynthesis pathway in P. grandiflorus. 1-Deoxy-d-xylulose-5-phosphate synthase (PgDXS); 2-C-methyl-d-erythritol 4-phosphate cytidylyltransferase (PgMCT); 4-diphosphocytidyl-2-C-methyl-D-erythritol kinase (PgCMK); 2-C-methyl-d-erythritol 2,4-cyclodiphosphate synthase (PgMCS); (E)-4-Hydroxy-3-methylbut-2-enyl-diphosphate synthase (PgHDS); 4-Hydroxy-3-methylbut-2-en-1-yl diphosphate reductase (PgHDR); Isopentenyl diphosphate isomerase (PgIDI); Acetyl-CoA C-acetyltransferase (PgAACT); Hydroxymethylglutaryl-CoA synthase (PgHMGS); Hydroxymethylglutaryl-CoA reductase (PgHMGR); Mevalonate kinase (PgMK); Diphosphomevalonate decarboxylase (PgMDC); Geranyl pyrophosphate synthase (PgGPPS); Farnesyl diphosphate synthase (PgFPPS); Squalene synthase (PgSQS); Squalene monooxygenase (PgSQE); β-Amyrin synthase (Pgβ-AS).
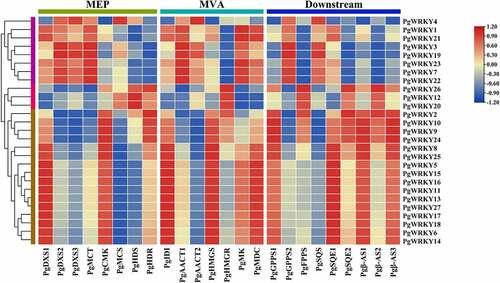
Figure 9. GO analysis of PgWRKY proteins. The results are grouped into three main categories: biological process, cellular component, and molecular function. The X-axis indicates the number of genes.
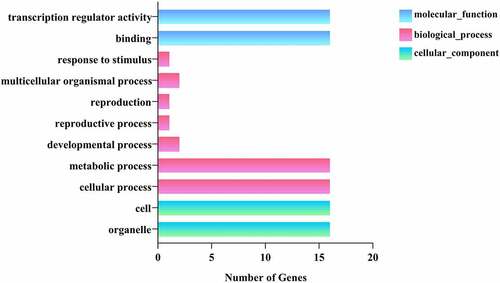
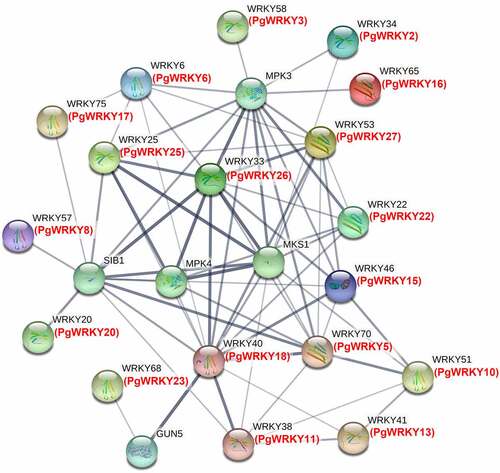
Figure 10. Protein-protein interaction network of specific PgWRKY proteins. Black and red color characters represent A. thaliana and P. grandiflorus, and the thick lines represent the strength of interaction.