Figures & data
Figure 1. Volcano plot of DEGs (A, B, C), number of DEGs (D), Venn diagrams of DEGs (E), PCA (F) and heatmap of DEGs (G) in mulberry (Morus alba L.) leaves under flooding stress. DEGs, differentially expressed genes; PCA, principal component analysis.
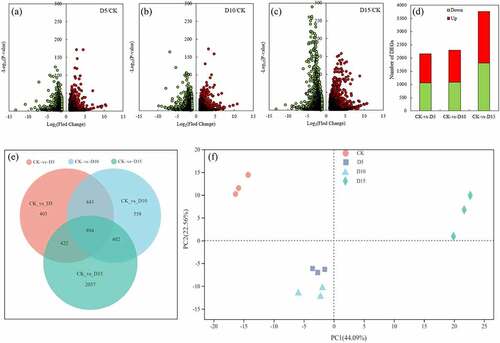
Figure 1. (continued)
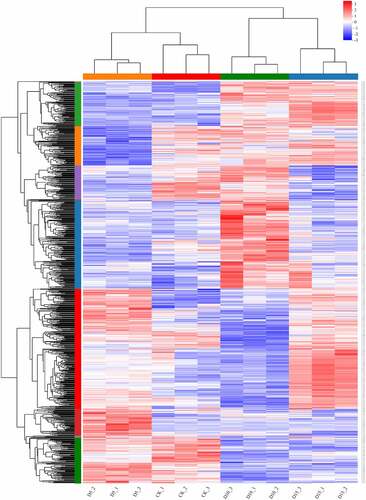
Figure 2. Kyoto Encyclopedia of Genes and Genomes (KEGG) pathway enrichment analysis of DEGs in mulberry (Morus alba L.) leaves under flooding stress. DEGs, differentially expressed genes.
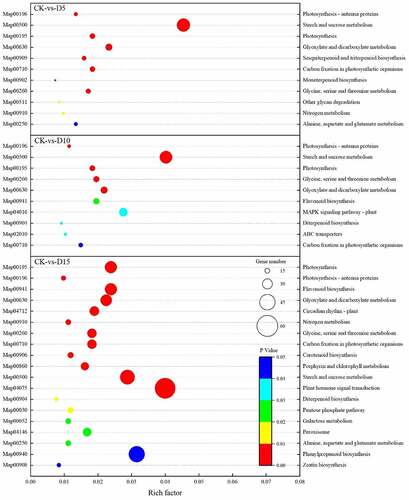
Figure 3. Chlorophyll a (Chl a), chlorophyll b (Chl b), chlorophyll a + b (Chl a + b) content and chlorophyll a/b (Chl a/b) ratio (A) and expression of the genes of chlorophyll synthesis (B) and chlorophyll degradation (C) in mulberry (Morus alba L.) leaves under flooding stress.
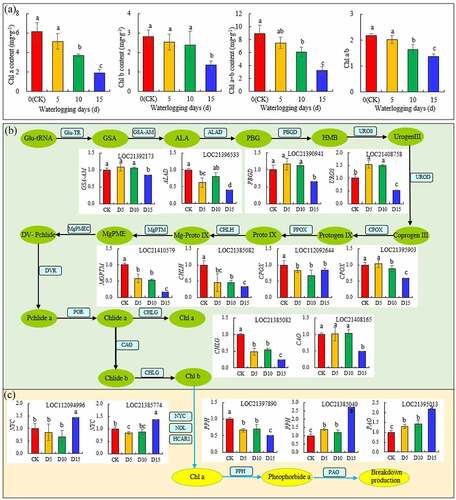
Figure 4. OJIP curve (A), MR820 curve (B), Fv/Fm (C), PIABS (D), PItotal (E), ΔI/Io (F) in mulberry (Morus alba L.) leaves under flooding stress.
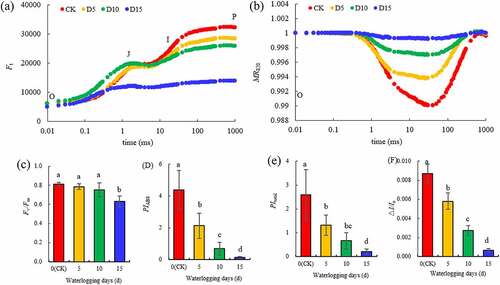
Figure 5. Standardized O-P(VO-P), O-J(VO-J) and O-K curve(VO-K) (A, B, C), difference between the standardized O-P(∆VO-P), O-J(∆VO-J), and O-K curve(∆VO-K)and the CK (D, E, F), and the value of VJ (G), VK (H) and VL (I) in mulberry (Morus alba L.) leaves under flooding stress.
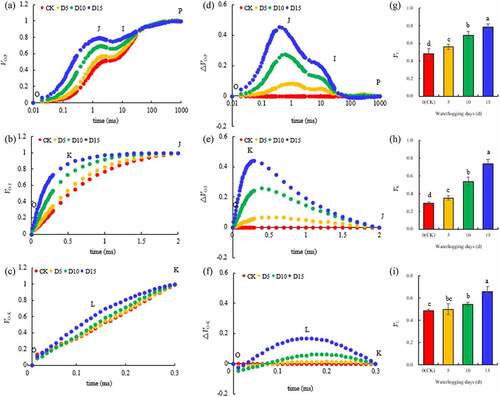
Figure 6. Levels of expression of the genes for the photosynthetic antenna proteins (A), PSI I (B), PSI (C) and photosynthetic electron transport (D) proteins in mulberry (Morus alba L.) leaves under flooding stress. PSI I, photosystem I.
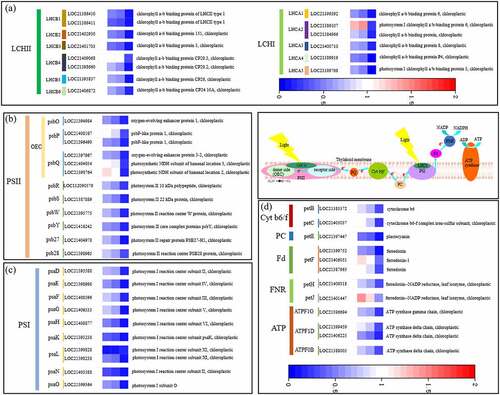
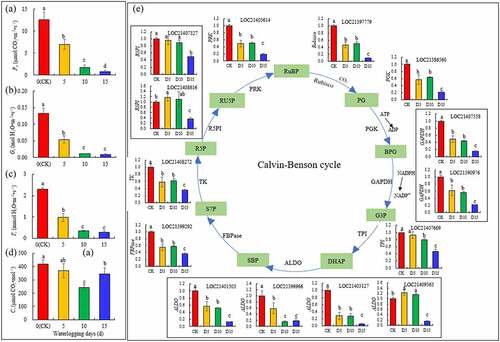
Figure 7. Photosynthetic gas exchange parameters (A) and levels of expression for the genes that encode key enzymes in the Calvin cycle (B) in mulberry (Morus alba L.) leaves under flooding stress.