Figures & data
Figure 1. Phenotype of POsTZF1:OsTZF1-OX and control plants. A) Rice seedling growth of control and POsTZF1:OsTZF1-OX after 10 d of germination. B) Transgenic rice POsTZF1:OsTZF1-OX (#1 and #3), and control plants grown in soil exhibited similar phenotype. C) Leaves from control and POsTZF1:OsTZF1-OX (#1 and #3) plants at seed setting stage. No brown lesions were observed. D) Phenotype of seeds harvested from control and POsTZF1:OsTZF1-OX (#1 and #3) at the time of harvest.
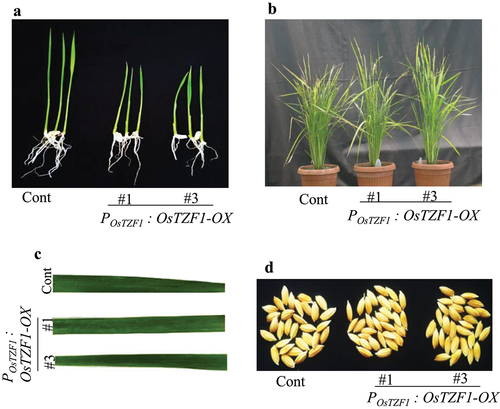
Figure 2. Delayed leaf senescence phenotype of Ubi:OsTZF1-OX and POsTZF1:OsTZF1-OX compared to controls under different senescence inducing conditions. Leaf fragments from the OsTZF1-OX and control plants were incubated in 10 µM MeJA, 10 µM ABA, 100 µM SA and 250 mM NaCl solutions in the dark for 4 d.
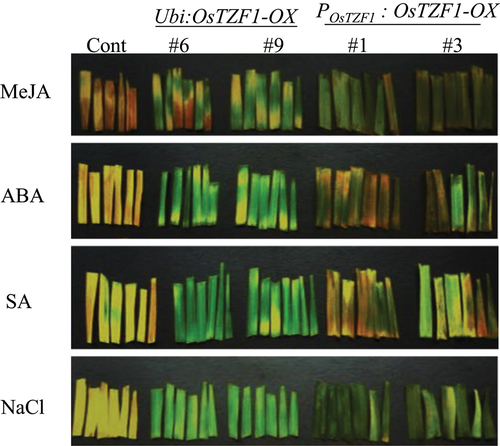
Figure 3. A) Salt-stress tolerance of POsTZF1:OsTZF1-OX OsTZF1-RNAi and control plants. The results are the average of three independent experiments with 12 plants per experiment. Asterisks indicate statistical significance (*, P < .050). B) Dehydration stress tolerance of POsTZF1:OsTZF1-OX, OsTZF1-RNAi and control plants. The results are the average of three independent experiments with 12 plants per experiment. Asterisks indicate statistical significance (*, P < .050).
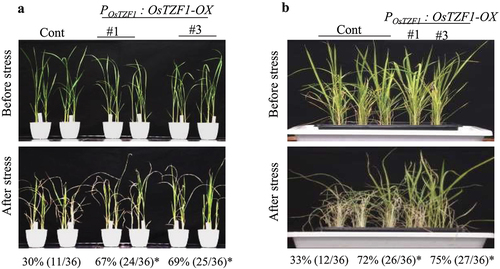
Figure 4. Comparative transcriptome analysis of Ubi:OsTZF1-OX and POsTZF1:OsTZF1-OX up-regulated and downregulated genes under high salt stress. A) Venn diagram of Ubi:OsTZF1-OX and POsTZF1:OsTZF1-OX up- regulated genes, where 148 genes were co-expressed. B) Venn diagram of Ubi:OsTZF1-OX and POsTZF1:OsTZF1- OX down-regulated genes, where 134 genes were co-expressed. C) Heat map of 148 upregulated genes co- expressed in Ubi:OsTZF1-OX and POsTZF1:OsTZF1-OX under 250 mM NaCl stress. D) Heat map of 134 downregulated genes co-expressed in Ubi:OsTZF1-OX and POsTZF1:OsTZF1-OX under 250 mM NaCl stress.
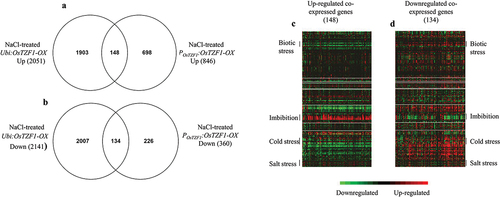
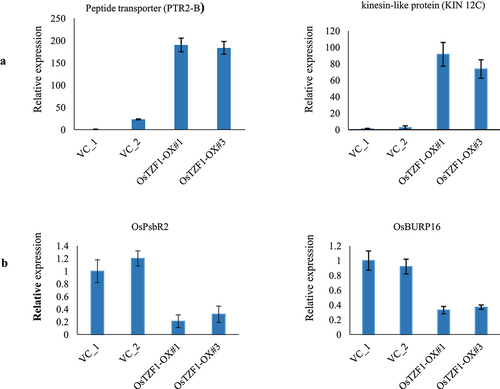
Figure 5. qRT-PCR analysis of up-regulated genes identified in POsTZF1:OsTZF1-OX plants by microarray analysis. A) The analyzed upregulated genes were peptide transporter (Os01g0871600) and kinesin-like protein (Os03g0587200). B) The downregulated genes analyzed were OsPsbR2 (Os07g0147550) and OsBURP16 (Os10g0409400).