Figures & data
Figure 1. Growth and phenotype of nine sugar beet genotypes under LN stress. Low nitrogen (LN): 0.5 mmol·L−1 N; CK: 10 mmol·L−1, the same key applies to other figures and tables.
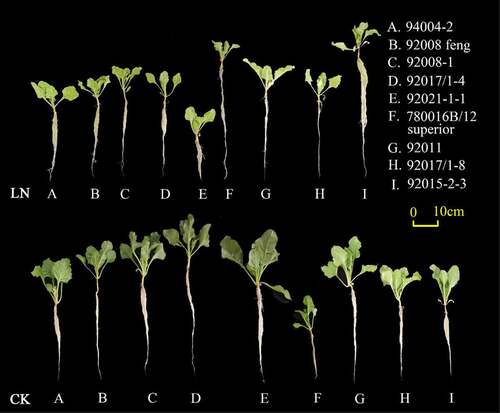
Figure 2. Effect of LN on the root morphology of the nine sugar beet genotypes.
Figure 3. Morphological changes in the nine sugar beet genotypes under low nitrogen treatment. (a) Hypocotyl diameter, (b) plant height, (c) root length, (d) total root surface, and (e) leaf area. Lowercase letters indicate a significant difference between each genotype at the same nitrogen supply level (p < .01), as analyzed by Duncan’s multiple tests. The same key applies to other figures.
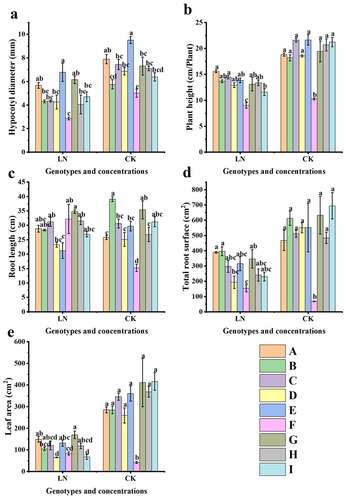
Figure 4. Changes in chlorophyll a content (a), chlorophyll b content (b), chlorophyll content (c), Chl a/b (d) and soluble protein (e) in different sugar beet genotypes under low nitrogen treatment.
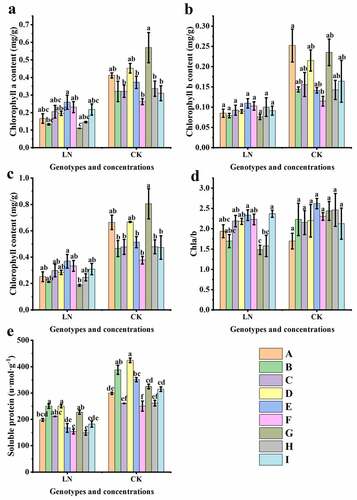
Figure 5. Biomass of different genotypes under low nitrogen treatment. (a) Leaf fresh weight, (b) root fresh weight, (c) leaf dry weight, (d) root dry weight, and (e) root to shoot ratio.
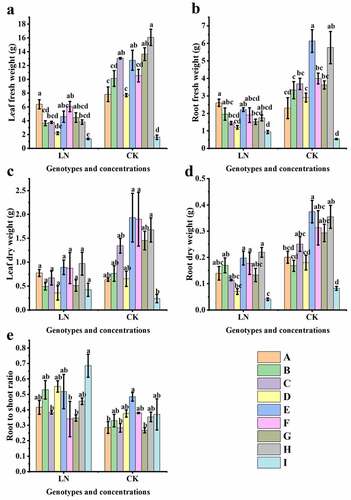
Figure 6. Distribution characteristics of N in nine genotypes under different nitrogen supply levels. (a) N content in leaves; (b) N content in roots.
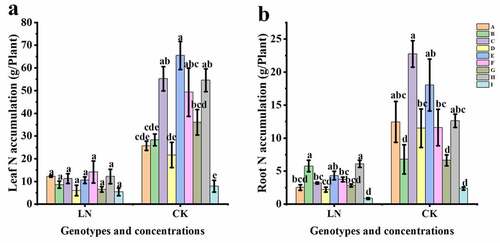
Figure 7. Low nitrogen tolerance of nine sugar beet genotypes by Pearson correlation coefficient (r) analysis. Hypocotyl diameter: HD; Plant height: PH; Root length: RL; Total root surface: TRS; Leaf area: LA; Chlorophyll a: Chl a; Chlorophyll b: Chl b; Chlorophyll content: Chl; Chl a and b ratio: Chl a/b; Soluble protein: SP; Leaf fresh weight: LFW; Root fresh weight: RFW; Leaf dry weight: LDW; Root dry weight: RDW; Root-to-shoot ratio: RSR; Leaf N accumulation: LNA; and Root N accumulation: RNA. The same abbreviations are used below. All the data were based on the ratio of N deficiency to N sufficiency. Scale: the bright blue to bright red colors represent negative and positive correlations, respectively. *: P < .05, **: P < .01.
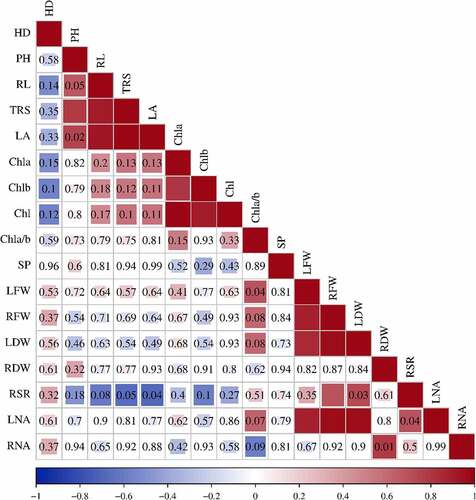
Table 1. Variation coefficient of LN tolerance-related growth characteristics in nine sugar beet genotypes.
Table 2. PCA and comprehensive evaluation of the nine sugar beet genotypes.
Figure 8. Changes in the physiological activity of LN-tolerant and LN-sensitive sugar beets under different nitrogen supply levels. (a) SOD activity, (b) POD activity, (c) CAT activity, (d) APX activity, (e) MDA content, and (f) proline content. Lowercase letters indicate a significant difference between each germplasm and nitrogen supply level (p < .01).