Figures & data
Figure 1. (a). The whole plant of P. asiatica. (b). The flowers of P. asiatica. (c). The original plant of P. depressa. (d). The specimen of P. asiatica.
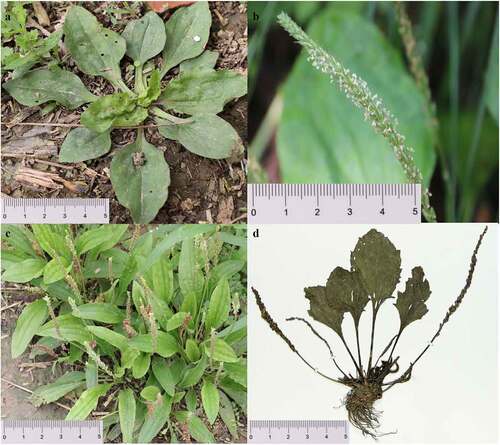
Table 1. The primary characteristics of the P. asiatica chloroplast genome.
Figure 2. Circular map of the chloroplast genome of P. asiatica. Genes drawn inside the circle are transcribed clockwise, while those outsides are transcribed counter-clockwise. Genes are color-coded to imply functional groups. The dark gray area in the inner circle corresponds to the GC content while the light gray corresponds to the AT content of the genome. The SCC, LSC, IRa and IRb regions are noted in the inner circle.
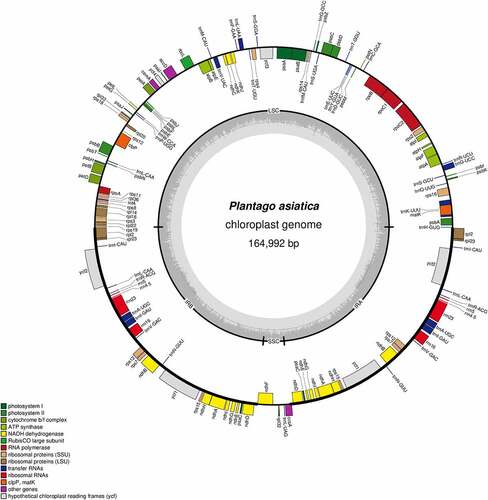
Table 2. The length of introns and exons in genes with introns in P. asiatica.
Table 3. A list of genes found in the plastid genome of P. asiatica.
Figure 3. Genes functional annotation in the complete chloroplast genome of P. asiatica. (a). The GO classification of genes is based on biological processes, molecular functions, and cellular components. (b). The KEGG pathway categories corresponding to genes in P. asiatica chloroplast.
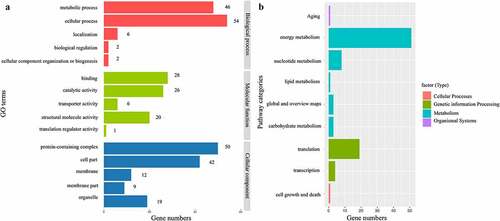
Figure 4. The type, number, and presence of SSRs and long repeats in the Cp genome of P. asiatica. (a) Presence of SSRs in the LSC, SSC, IRa, and IRb regions. (b) Presence of long repeats in the LSC, IRa, and IRb regions. (c) Type and number of SSRs in the Cp genome of P. asiatica.
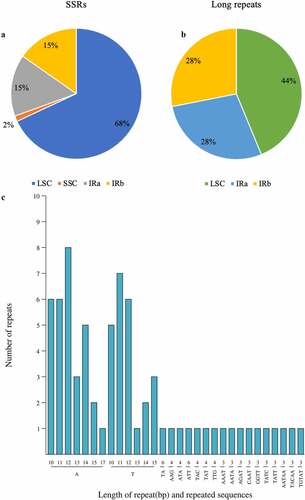
Figure 5. RSCU histogram of P. asiatica. The blocks underneath stand for different codon encoding amino acids. The columns on the top depict the sums of RSCU values of the 20 amino acids.
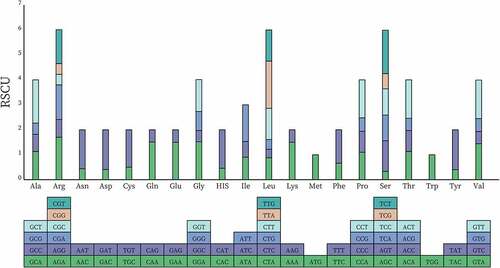
Table 4. The predicted RNA editing sites in P. asiatica chloroplast genome.
Figure 6. Comparison of the Cp genome sequences of P. asiatica, P. depressa, P. ovata, P. lagopus, P. grandiflorus, and A. thaliana generated using mVISTA. Gray arrows symbolize the position and direction of the genes. Red and blue areas indicate intergenic and genic regions, respectively. Black lines represent regions of sequence identity with P. asiatica, with a 50% identity cutoff. Dashed rectangles denote highly divergent regions when P. asiatica compared to P. depressa, P. ovata, P. lagopus, P. grandifloras, and A. thaliana.
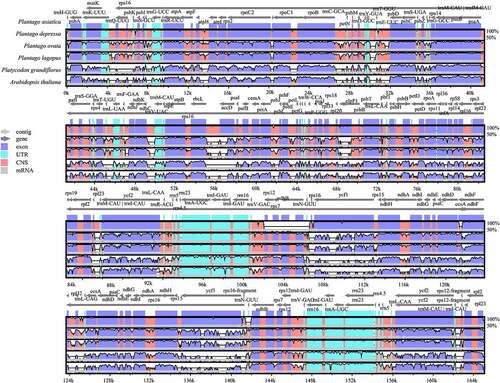
Figure 7. Comparison of the borders of the LSC, SSC, and IR regions of P. asiatica, P. lagopus, P. depressa, P. media, P. ovata, P. auriculata and Arabidopsis thaliana.
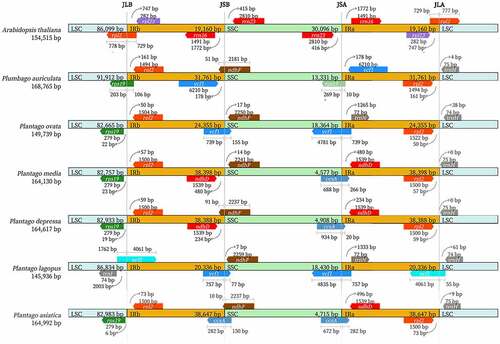
Figure 8. Phylogenetic tree plotting using ML method, based on aligning the completed chloroplast genome sequences of Plantago asiatica L. and 17 other representative species. The numbers above the nodes are support values with ML bootstrap values. The distance bar was implied by the ML method.
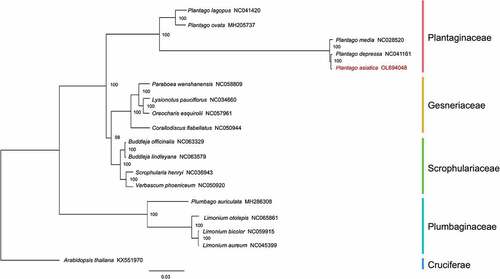
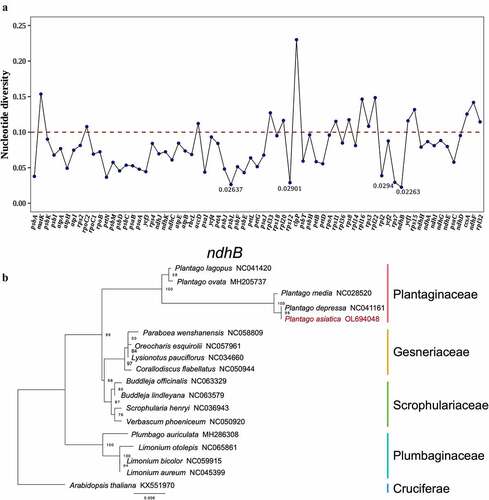
Figure 9. (a). Pi values of the protein coding genes. (b). Phylogenetic tree by maximum likelihood method of ndhB gene.