
Figures & data
Figure 1. (a) The phenotype of duckweed treated with or without music for 0–7 days; (b) Frond growth curve over 7 days of cultivation treated with or without music; (c) the contents of protein in duckweed treated with or without music were determined by using Coomassie Brilliant Blue staining. The error bars in the graph are standard errors (SE) with biological repetitions n = 5. *P < .05, **P < .01 represent significant differences and extremely significant differences, respectively.
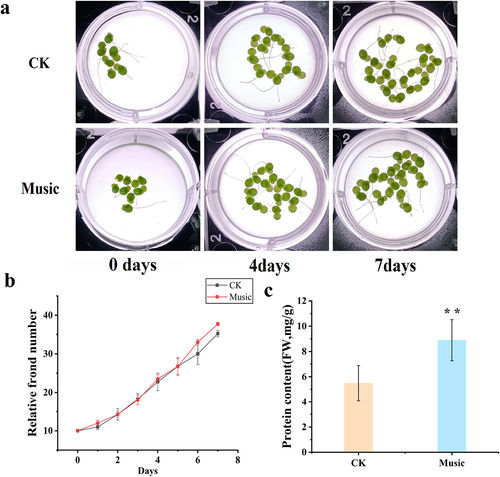
Figure 2. (a) Fv/Fm was determined after treatment with and without music. The error bars in the graph are standard errors (SE) with biological repetitions n = 4. *P < .05, **P < .01 represent significant differences and extremely significant differences; (b) Kyoto Encyclopedia of Genes and Genomes (KEGG) maps the pathways associated with photosynthetic antenna proteins. The box color was determined by the expression pattern of unigenes coding corresponding proteins. Red represents up-regulation, green represents down-regulation, and yellow represents mixed-regulation.
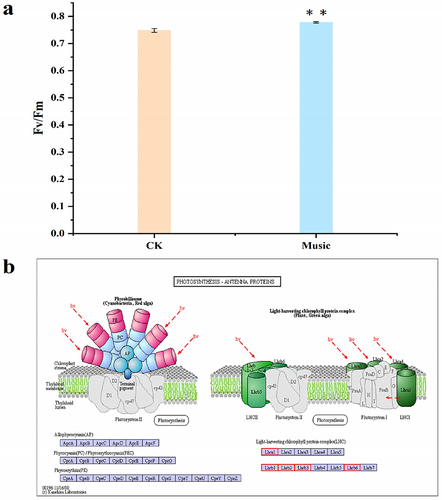
Figure 3. (a) The fluorescence in the iGluSnFR duckweed subjected to transient music for 16 min; (b) the Glu fluorescence intensity of the protoplasts in the roots of iGluSnFR duckweed was detected by flow cytometry, 6 thousand cells each group were analyzed. The iGluSnFR duckweed was treated with or without music for 10 h. The excitation wavelength was 488 nm. Scale bar = 20 μm (Ch 01 is the protoplast in bright, Ch 02 is fluorescently excited tong at 488 nm).
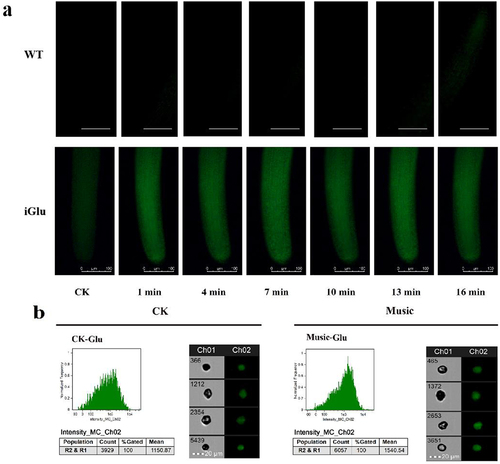
Figure 4. (a) The histogram showed differentially expressed genes in response to music treatment; (b) cluster analysis of DGEs in the “Music” and “CK”; (c) in the case of “Music vs CK”, the number of enriched up-regulated DEGs and down-regulated DEGs in different gene ontology categories. (d) KEGG enrichment scatter plot (Rich factor referred to the ratio of the number of differentially expressed genes in the pathway to the total number of all annotated genes in the pathway).
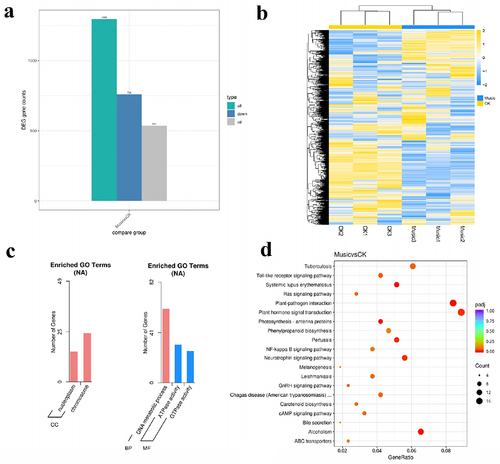
Figure 5. The duckweed was treated with or without music for 10 h and stained by Flou-4 AM. Ca content in protoplast analyzed by flowsight system in 488 nm. Scale bar = 20 μm (Ch 01 is the protoplast in bright, Ch 02 is fluorescently excited tong at 488 nm).
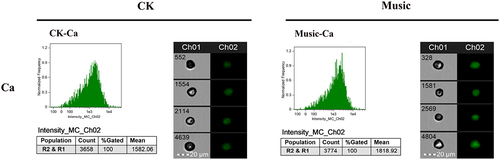
Figure 6. The response of the Ca signal pathway under music treatment. The channels and proteins associated with Ca signal transduction were shown in the figure. The color of letters and arrows represented the change in the DEGs: red indicated up-regulated, green indicated down-regulated, and yellow indicated mix-regulated. The heat map next to the arrow showed the expression of different genes encoded the protein in Music and CK duckweed. Red meant high expression; blue meant low expression. (Rac: Ras-related C3 botulinum toxin substrate 1, AdipoR: adiponectin receptor, CPK: creatine kinase, AMPK: AMP-activated protein kinase, GPCR: GTP-binding protein, CBP: CREB-binding protein, CBL: calcineurin B-like protein, CAM: calmodulin).
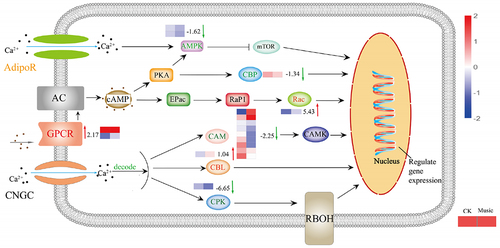
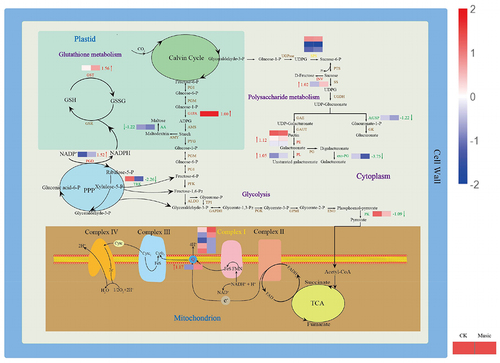
Figure 7. The metabolic mechanism of duckweed was influenced by music. Metabolites (in black) and proteins with enzymes and transporters are shown. The arrows beside or through proteins indicate the directions of catalytic reactions or transportation. Red arrows represent upregulation, green arrows represent downregulation, and yellow arrows represent mixed regulation. The heat map next to the arrow showed the expression of different genes encoded the protein in Music and CK duckweed. Red meant high expression; blue meant low expression. (INV: in+vertase, SPS: sucrose-phosphate synthase, G1PA: glucose-1-phosphate adenylyltransferase, PK: pyruvate kinase, PE: pectinesterase, PL: pectate lyase, exo-PG: galacturan 1,4-alpha-galacturonidase, AtUSP: UDP-sugar pyrophosphorylase, AA: alpha-amylase, GST: glutathione S-transferase, PGD:6-phosphogluconate dehydrogenase, TRK: transketolase, ND5: NADH-ubiquinone oxidoreductase chain 5, NdhB: NAD (p) H-quinone oxidoreductase subunit 2).
Supplemental Material
Download MS Word (508 KB)Data availability statement
All relevant data are within the manuscript and its Supporting Information files.