Figures & data
Figure 1. Effects of exogenous GABA and MT on tomato seed germination under Cd stress. (CK, the control; CD, 100 µM Cd; 10, 50, 100, 150, 200 µM, repent the tomato seedlings treatment with GABA, MT and GABA plus MT at 10, 50, 100, 150 and 200 μM, respectively, in the presence of 100 μM Cd. A: Germination rate experiment were calculated on 7th day after sowing; B: Germination potential experiment were calculated on the 3rd day after sowing; C: Vitality Index experiment were calculated on 7th day after sowing; D: Germination Index experiment were calculated on 7th day after sowing. The data shown are the averages of three replicates, with the standard errors indicated by the vertical bars. The means denoted by the same letter do not significantly differ at a P < 0.05.
Figure 2. Effects of exogenous γ-aminobutyric acid, melatonin and their combination on the phenotype and biomass of tomato shoots under cadmium stress (CK, the control; CD, 100 µM Cd; 10, 50, 100, 150, 200 µM, repent the tomato seedlings treatment with GABA, MT and GABA plus MT at 10, 50, 100, 150 and 200 μM, respectively, in the presence of 100 μM Cd. A: MT-treated bud phenotype on 7th day after sowing; B: GABA-treated bud phenotype on 7th day after sowing; C: GABA plus MT-treated bud phenotype on 7th day after sowing; D: Effects of exogenous γ-aminobutyric acid and melatonin and their combination on fresh weight of tomato shoots under cadmium stress; E: exogenous γ-aminobutyric acid and melatonin and their combination on dry weight of tomato shoots under cadmium stress; F: exogenous γ-aminobutyric acid and melatonin and their combination on the radicle lengths of tomato shoots under cadmium stress). The data shown are the averages of three replicates, with the standard errors indicated by the vertical bars. The means denoted by the same letter do not significantly differ at a P < 0.05.
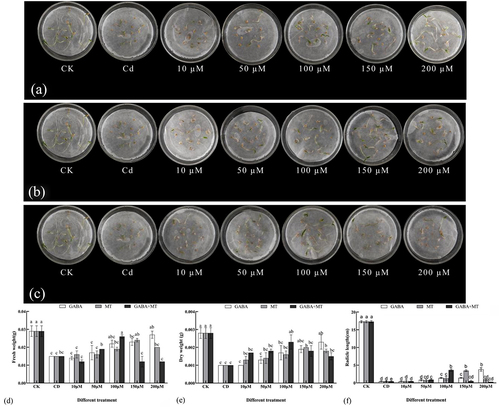
Figure 3. Effects of exogenous γ-aminobutyric acid, melatonin and their combination on the MDA content of tomato shoots under cadmium stress. (CK, the control; CD, 100 µM Cd; 10, 50, 100, 150, 200 µM, repent the tomato seedlings treatment with GABA, MT and GABA plus MT at 10, 50, 100, 150 and 200 μM, respectively, in the presence of 100 μM Cd). The data shown are the averages of three replicates, with the standard errors indicated by the vertical bars. The means denoted by the same letter do not significantly differ at a P < 0.05.
Figure 4. Effects of exogenous γ-aminobutyric acid, melatonin and their combination on the POD content of tomato shoots under cadmium stress. (CK, the control; CD, 100 µM Cd; 10, 50, 100, 150, 200 µM, repent the tomato seedlings treatment with GABA, MT and GABA plus MT at 10, 50, 100, 150 and 200 μM, respectively, in the presence of 100 μM Cd). The data shown are the averages of three replicates, with the standard errors indicated by the vertical bars. The means denoted by the same letter do not significantly differ at a P < 0.05.
Figure 5. Effects of exogenous γ-aminobutyric acid, melatonin and their combination on the CAT activity of tomato shoots under cadmium stress. (CK, the control; CD, 100 µM Cd; 10, 50, 100, 150, 200 µM, repent the tomato seedlings treatment with GABA, MT and GABA plus MT at 10, 50, 100, 150 and 200 μM, respectively, in the presence of 100 μM Cd). The data shown are the averages of three replicates, with the standard errors indicated by the vertical bars. The means denoted by the same letter do not significantly differ at a P < 0.05.
Figure 6. Effects of exogenous γ-aminobutyric acid, melatonin and their combination on the soluble protein content of tomato shoots under cadmium stress. (CK, the control; CD, 100 µM Cd; 10, 50, 100, 150, 200 µM, repent the tomato seedlings treatment with GABA, MT and GABA plus MT at 10, 50, 100, 150 and 200 μM, respectively, in the presence of 100 μM Cd). The data shown are the averages of three replicates, with the standard errors indicated by the vertical bars. The means denoted by the same letter do not significantly differ at a P < 0.05.
Figure 7. Effects of exogenous γ-aminobutyric acid, melatonin and their combination on Cd content of tomato shoots under cadmium stress. (CK, the control; CD, 100 µM Cd; 10, 50, 100, 150, 200 µM, repent the tomato seedlings treatment with GABA, MT and GABA plus MT at 10, 50, 100, 150 and 200 μM, respectively, in the presence of 100 μM Cd). The data shown are the averages of three replicates, with the standard errors indicated by the vertical bars. The means denoted by the same letter do not significantly differ at a P < 0.05.