
Figures & data
Figure 1. Visual comparison of sorghum and rice plants used in experiments.
Sorghum and rice plants were potted in soil and grown in cultivation room for 4 and 6 weeks (sorghum) or 6 weeks (rice). Upper panel shows that size of sorghum plants at 4 weeks is comparable to rice at 6 weeks (lower panel, left). Sorghum at 6 weeks produces broader leaves and becomes larger than rice at the same age.
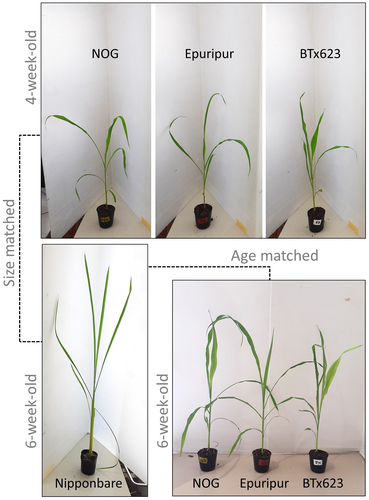
Figure 2. Comparison of sorghum and rice volatile profiles.
The ion fragment m/z 93 representing terpenoid compounds was extracted from chromatograms of untreated rice (Nip-Cont), artificial herbivory-treated rice (Nip-WOS), untreated sorghum (BTx623-Cont) and treated sorghum (BTx623-WOS). Bottom chromatogram shows mixture of standard compounds (Std) run under the same conditions in GC-MS. In order to show peaks in sorghum, chromatograms are magnified 50× (scale 0-50 kCounts) compared to rice (scale 0-2.5 MCounts). Representative compounds occurring in both plants are labeled with numbers: 1, α-pinene; 2, myrcene; 3, D-limonene; 4, linalool; 5, β-caryophyllene; 6, β-farnesene; C, contaminant peak of butylated hydroxytoluene.
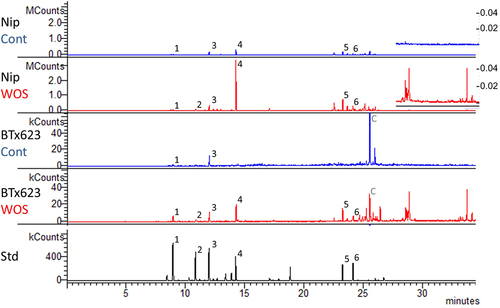
Figure 3. Accumulation of major VOCs in headspace of sorghum and rice.
Three sorghum varieties (BTx623, Epuripur and NOG), either size or age matched with rice plants, were placed in acrylic cylinders and VOCs were captured by Porapak filters. After elution and GC-MS runs, compound peaks in specific ion chromatogram traces were quantified and the content of monoterpenes, sesquiterpenes, homoterpenes, indole/aromatic compounds, and green leaf volatiles (GLVs) was determined against external calibration curves. For compounds without authentic standards (labeled with ‘#’), the content was quantified against representative compounds from a similar structural group (DMNT as linalool equivalent; β-elemene and TMTT as β-caryophyllene eq.). Data are means from independent samples (n = 4) with SE. Asterisks show significant differences between each pair of control (untreated) and WOS-treated plants (*P ≤ 0.05, **P ≤ 0.01, ***P ≤ 0.001). Different small letters show significant differences for each compound within the control group of samples (Control) determined by ANOVA with Tukey LSD. Differences within the treated group of samples (WOS) for each compound are shown with different capital letters.
Figure 4. Principal component analysis (PCA) of VOCs in headspace of sorghum and rice.
VOCs in sorghum and rice headspace shown in and Table S1 were subjected to PCA analysis using MetaboAnalyst tool. (a) 3D-PCA plot shows a clear separation of rice VOCs (yellow) from sorghum samples (BTx623, red; Epuripur, blue; NOG, green). A separation also occurs between Epuripur and two other sorghums. Circles represent untreated 4-week-old plants (control); squares are 4-week-old plants treated with artificial herbivory (WOS); triangles are untreated plants at 6 weeks; diamonds are 6-week-old plants treated with WOS. (b) Loading plots show compounds with the highest contribution to the separation of headspace volatiles in rice and sorghum.
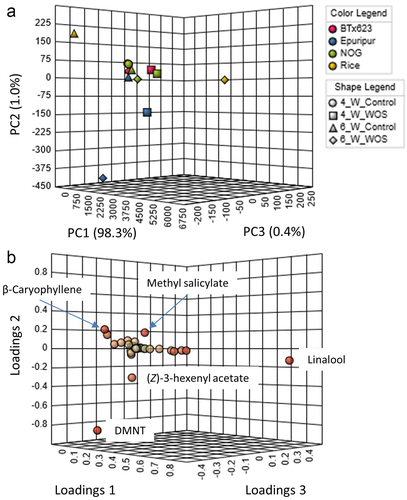
Figure 5. Diurnal profiles of headspace VOCs released from C3 rice (Nipponbare) and C4 sorghum (BTx623).
Sorghum and rice plants at 6 weeks were placed in acrylic cylinders and VOCs were trapped on Porapak filters in 3 h intervals (A, 6AM-9AM; B, 9AM-12AM, C, 12AM-3PM; D, 3PM-6PM; E, 6PM-9PM; F, 9PM-12PM; G, 12PM-3AM; H, 3AM-6AM; I, 6AM-9AM). Plants were either untreated (Control) or treated with artificial herbivory (WOS) twice on the previous day at 3PM and 5PM. Data are means from independent samples (n = 3) with SE. L, light period, D, dark period.
Figure 6. Expression analysis of putative sorghum linalool synthase SbTPS14.
Notes: Sorghum cDNAs were prepared from control and WOS-treated sorghum samples. RT-qPCR was performed to determine transcript abundances of sorghum linalool synthase in BTx623, Epuripur and NOG leaves. Data are means ±SE (n = 3-4). Asterisks show significant differences determined by Student’s t-test between pairs of control (untreated) and WOS-treated plants at the same time point (*P ≤ 0.05, ***P ≤ 0.001).
Supplemental material