Figures & data
Figure 1. Frequency spectrum of ELF MF based on.Citation6 The red lines indicate the frequencies of the first, second and third harmonics of the Schumann resonance − 7.8, 14.3 and 20.3 Hz. The blue dots indicate the frequencies at which the experiment was performed: the second harmonic of the Schumann resonance (14.3 Hz), its neighborhood (13.3 and 15.3 Hz) and the regions between resonances (10.5 and 18 Hz). The color coding of the points corresponds to that in the following figures.
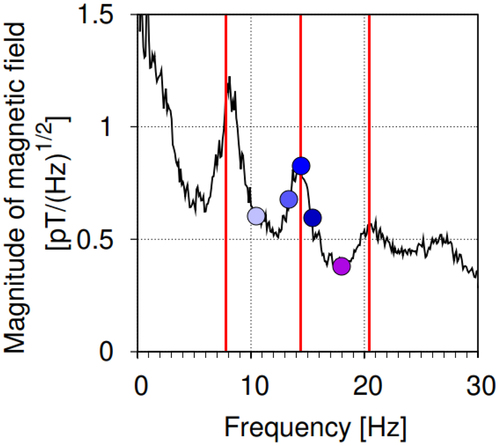
Figure 2. Effect of magnetic fields with frequencies of 10.5, 13.3, 14.3 and 15.3 Hz on the morphometric parameters of wheat plants. (a) and (b) – length of leaves and roots, respectively, (c) and (d) – fresh weight of leaves and roots, respectively, (e) and (f) – dry weight of leaves and roots, respectively. C – plants grown under control conditions without an additional ELF MF. n = 60.
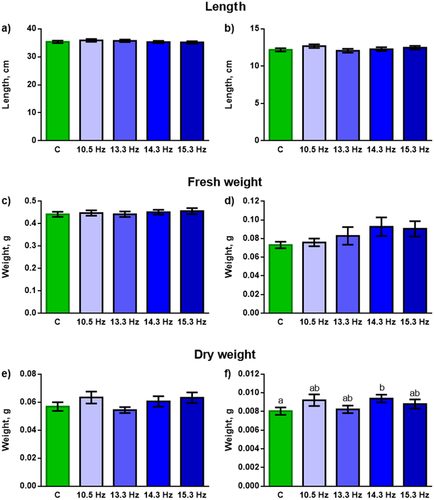
Figure 3. Effect of magnetic fields with frequencies of 10.5, 13.3, 14.3 and 15.3 Hz on the chlorophyll fluorescence parameters in wheat plants. (a) and (b) – averaged records of the dynamics of ФPSII and NPQ during the transition from a dark-adapted state to a light-adapted state. The inserts show fragments of the recording with transient processes in the range of 3–9 minutes. (c) and (d) – level of ФPSII and NPQ in a light-adapted (stationary) state. (e) and (f) – level of ФPSII and NPQ during the transition from a dark-adapted state to a light-adapted state. ФPSII – quantum yield of photosystem II. NPQ – non-photochemical quenching of chlorophyll fluorescence. C – plants grown under control conditions without an additional ELF MF. The color coding for graphs (a) and (b) corresponds to that for graphs (c) - f). n = 36.
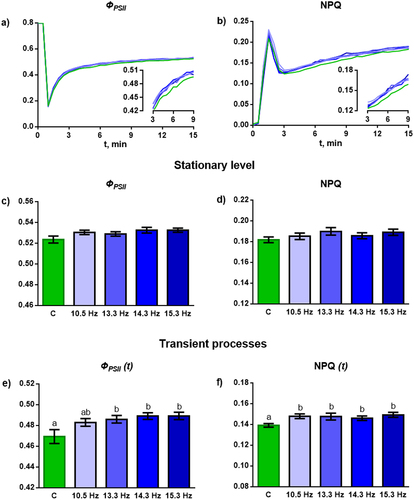
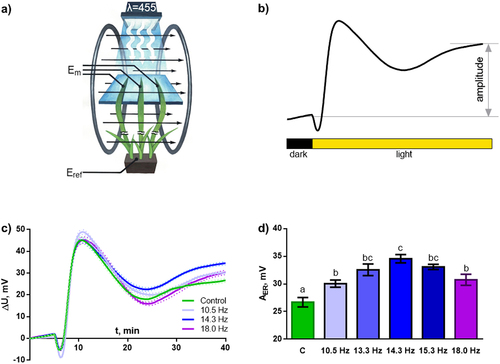
Figure 4. Effect of magnetic fields with frequencies of 10.5, 13.3, 14.3, 15.3 and 18 Hz on the parameters of light-induced electrical reactions of wheat plants. (a) – scheme for recording light-induced electrical reactions. Illumination was produced with blue light (455 nm) using an LED matrix. Measuring electrodes (Em) were located on the illuminated areas of the plant leaf. The reference electrode was located in the root area without light. (b) – scheme for calculating the amplitude of light-induced electrical reactions of wheat plants. (c) – averaged recordings of light-induced electrical reactions under MF with frequencies of 10.5, 14.3 and 18 Hz. The dotted line indicates standard error of mean (SE). (d) – amplitudes of light-induced electrical reactions (AER) under MF with frequencies of 10.5, 13.3, 14.3, 15.3 and 18 Hz. C – plants grown under control conditions without an additional ELF MF. n = 30.