Figures & data
Figure 1. Overview of the experimental set-up. A. thaliana plants were grown hydroponically for 3 weeks under nitrate- and oxygen-replete conditions (+NO3−/+O2). Afterwards, the plants were divided into two groups receiving either adequate nitrate (+NO3−) or nitrate starvation (-NO3−). After one week, each group was further divided in two subgroups, oxygen-replete (+NO3−/+O2 and -NO3−/+O2) or hypoxia (+NO3−/-O2 and -NO3−/-O2), and incubated for another 16 h.
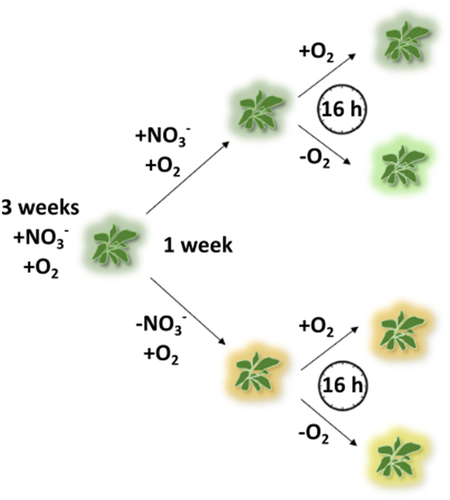
Figure 2. Effects of nitrate starvation and hypoxia on the phenotype and physiological parameters of A. thaliana. A) phenotype of plants with dissected leaves and roots, B) leaf dry weight, C) root dry weight, D) root to leaf dry weight ratio, E) leaf chlorophyll content, F) NO content of the root tip and lateral root (1 cm). NO3−/O2 treatments are described in . Error bars represent standard deviations calculated from biological replicates (n = 3 in B-E, n = 4 in F). Grey boxes represent statistical analysis by 2-way ANOVA: +NO3−, nitrate; O2, oxygen; NO3−xO2, interactions between nitrate and oxygen. Significance levels are indicated as ns p > 0.05, * p < 0.05, ** p < 0.01, *** p < 0.001, and **** p < 0.0001. Subsequently, a Tukey’s HSD post hoc test was performed to identify significant differences between all different treatments (multiple comparison), represented as stars on the bars.
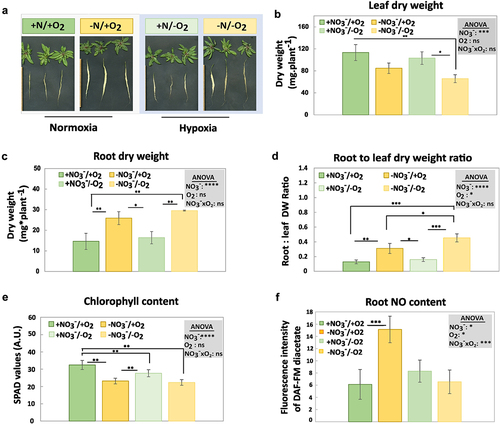
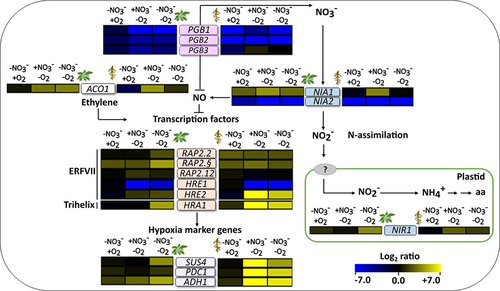
Figure 3. Effects of nitrate starvation and hypoxia on the transcript levels of marker genes. The color scale represents the log2 fold changes in transcript levels relative to the control condition (+NO3−/+O2), with the changes in leaves depicted on the left and the changes in roots depicted on the right of the gene names (blue, downregulated; yellow, upregulated). NO3−/O2, treatments are described in . The data represent the means of three biological replicates. The heatmap was generated using the multiple experiment viewer (MeV) software (https://webmev.tm4.org). Please note that the arrows may not fully explain the observed expression patterns but rather illustrate the known links between the different genetic and metabolic components. Supplementary figure S1 shows the same data with additional statistical details. SUS4, SUCROSE SYNTHASE 4; PDC1, PYRUVATE DECARBOXYLASE 1; ADH1, ALCOHOL DEHYDROGENASE 1; ACO1, 1-AMINOCYCLOPROPANE-1-CARBOXYLATE OXIDASE; RAP2.2, RELATED to AP2 2; RAP2.3, RELATED to AP2 3; RAP2.12, RELATED to AP2 12; HRA1, HYPOXIA RESPONSE ATTENUATER 1; HRE1, HYPOXIA RESPONSIVE ERF (ETHYLENE RESPONSE FACTOR) 1; HRE2, HYPOXIA RESPONSIVE ERF (ETHYLENE RESPONSE FACTOR) 2; NIA1, NITRATE REDUCTASE 1; NIA2, NITRATE REDUCTASE 2; NIR1, NITRITE REDUCTASE 1.