Figures & data
Figure 1. Effect of sub-optimal temperature on morphological and fresh weight of the two tomato cultivars. (a and b) the growth status of tomato seedlings with or without sub-optimal temperature; (c) root fresh weight; (d) stem fresh weight; (e) leaf fresh weight of S708 and T722 cultivars at control (CK, 25/18℃) and sub-optimal temperature (T, 15/10℃). Values are the mean±SD (n=3). Different low letters above the column denote the significant difference according to Tukey’s HSD test (p < 0.05).
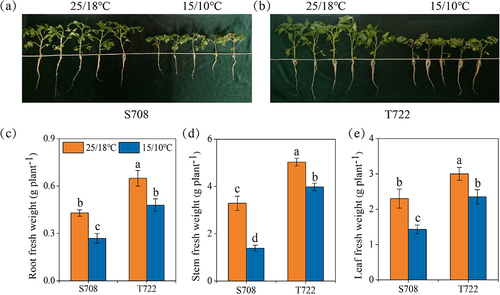
Figure 2. Chlorophyll content of the two tomato cultivars. (a) Chlorophyll a content; (b) chlorophyll b content; (c) carotenoid content of S708 and T722 cultivars at control (CK, 25/18℃) and sub-optimal temperature (T, 15/10℃). Values are the mean±SD (n=3). Different low letters above the column denote the significantly difference according to Tukey’s HSD test (p < 0.05).
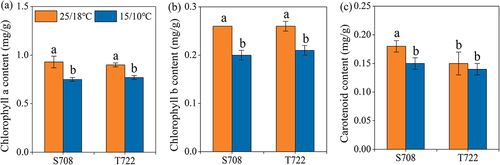
Figure 3. Chlorophyll fluorescence parameters of the two tomato cultivars. (a) maximum quantum yield of PSII, Fv/Fm; (b) effective quantum yield of photochemical energy conversion in PSII, Y(II); (c) photochemical quenching (qP); (d) electron transport rate (ETR). Chlorophyll fluorescence parameters of S708 and T722 cultivars at control (CK, 25/18℃) and sub-optimal temperature (T, 15/10℃). Values are the mean±SD (n=3). Different low letters above the column denote the significantly difference according to Tukey’s HSD test (p < 0.05).
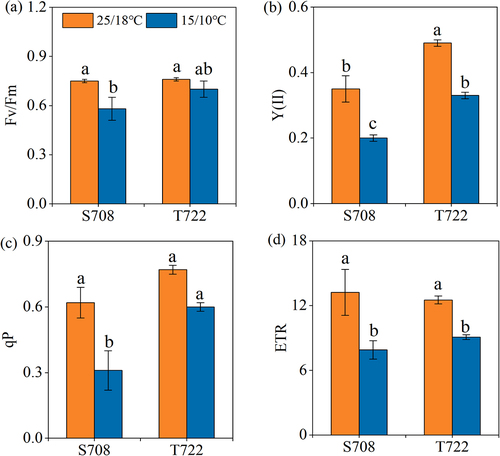
Figure 4. Soluble sugars content (a) and proline content (b) of S708 and T722 cultivars at control (CK, 25/18℃) and sub-optimal temperature (T, 15/10℃). Values are the mean±SD (n=3). Different low letters above the column denote the significantly difference according to Tukey’s HSD test (p < 0.05).
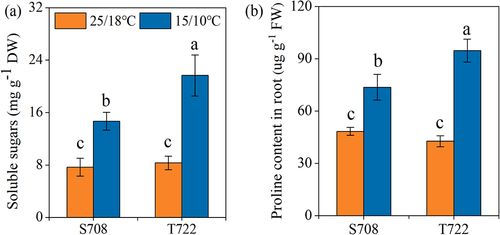
Figure 5. PCA analysis and RNA-seq analysis of tomato samples with or without sub-optimal treatment. (a) PCA analysis result (b) heat map showing the pairwise Spearman correlations among different treatments based on expression profiles of all genes (c) heat map for cluster analysis of the DEGs.
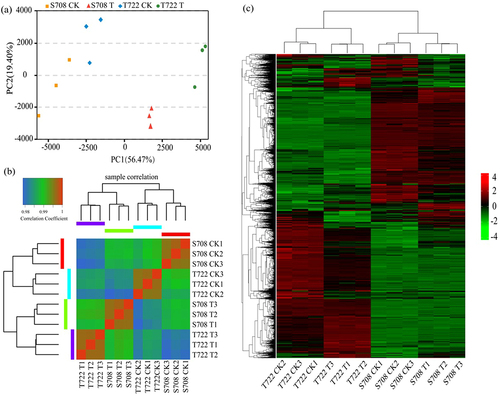
Figure 6. Gene ontology (GO) and KEGG analysis of up-regulated DEGs in both tomato cultivars (a,c) gene ontology (GO) term enrichment analysis of up-regulated DEGs in S708 and T722. The top15 GO term in both cultivars were shown. (b,d) KEGG enrichment analysis of up-regulated DEGs in S708 and T722.
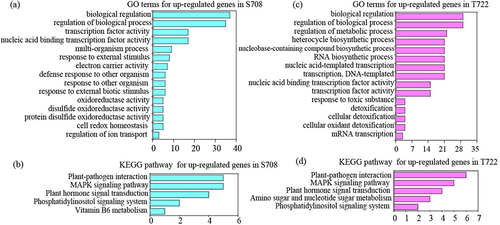
Figure 7. Number of TFs in S708 and T722 under sub-optimal temperature conditions. Within each bar, number of up- and down-regulated genes is shown in orange and blue, respectively. TFs, transcription factors.
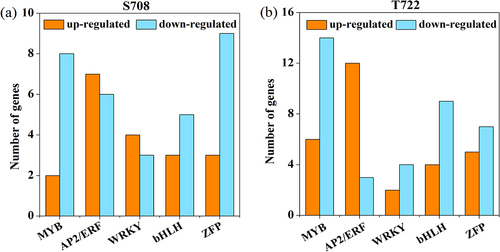
Figure 8. Heat map analysis of the DEGs of transcription factors. Changes in the expression levels (represented by the log2FC) of genes are highlighted by color scales (blue to red scale).
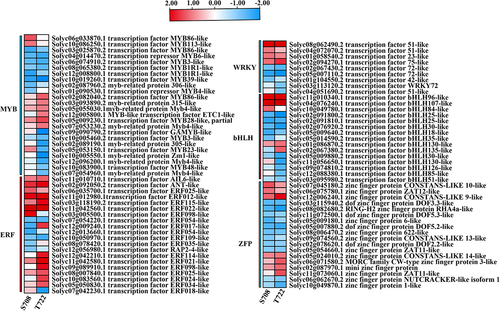
Figure 9. Heat map analysis of the DEGs involved in the osmoregulation system. Changes in the expression levels (represented by the log2FC) of genes are highlighted by color scales (blue to red scale).
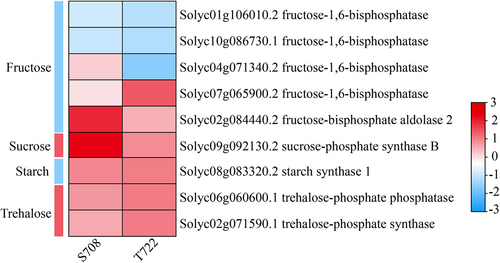
Figure 10. Validation of the RNA-seq expression by qPCR. Values are the mean±SD (n=3). Asterisks means a significant difference (*p < 0.05) with the control.