Figures & data
Table 1. Physicochemical characterization of digestate.
Figure 1. Evaluation of net photosynthesis rate after application of smoke (SMK) and biogas digestate (BGD) slurry. (a) lab conditions and (b) field conditions. The data are expressed as mean ± standard deviation of three replicates. The bars labeled with different alphabets are statistically significantly different at p < 0.005.
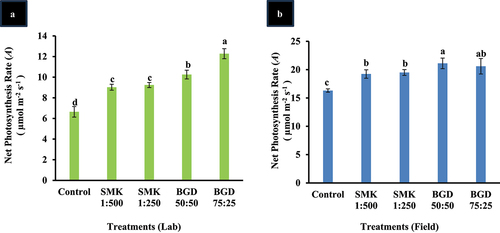
Figure 2. Water use efficiency after SMK and BGD treatment. (a) lab conditions and (b) field conditions. The data are expressed as mean ± standard deviation of three replicates. The bars labeled with different alphabets are statistically significantly different at p < 0.005.
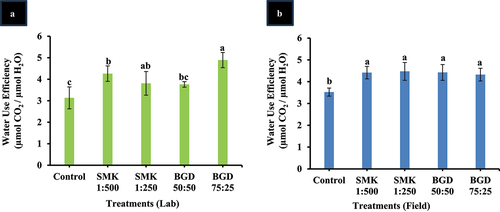
Figure 3. Analysis of pigments in SMK- and BGD-treated plants. (a) Chl a in lab conditions, (b) Chl b in lab conditions, (c) carotenoids in lab conditions, (d) Chl a in field conditions, (e) Chl b in field conditions, (f) carotenoids in field conditions. The data are expressed as mean ± standard deviation of three replicates. The bars labeled with different alphabets are statistically significantly different at p < 0.005.
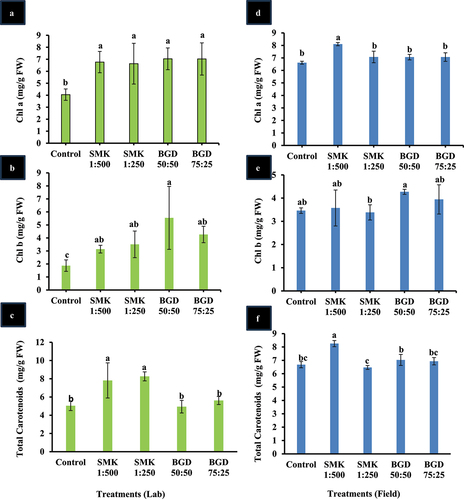
Figure 4. Analysis of growth parameters in SMK- and BGD-treated plants. (a) Leaf number in lab conditions, (b) dry weight in lab conditions, (c) leaf number in field conditions, (d) dry weight in field conditions. The data are expressed as mean ± standard deviation of three replicates. The bars labeled with different alphabets are statistically significantly different at p < 0.005.
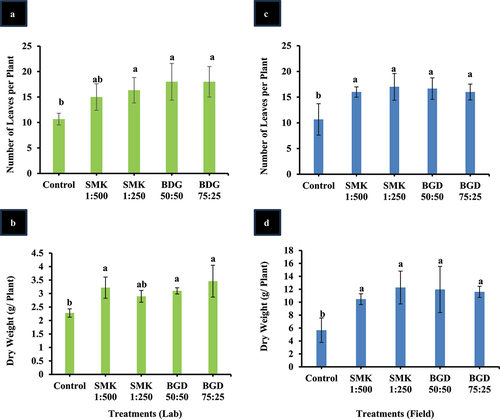
Figure 5. Enhancement in soluble sugars after SMK and BGD treatment. (a) lab conditions and (b) field conditions. The data are expressed as mean ± standard deviation of three replicates. The bars labeled with different alphabets are statistically significantly different at p < 0.005.
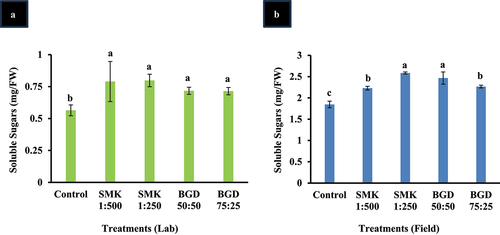
Figure 6. Principal component analysis (PCA) of SMK- and BGD-treated plants. (a) Treatments in lab conditions, (b) treatment responses in lab conditions, (c) treatments in in field conditions, (d) treatment responses in field conditions.
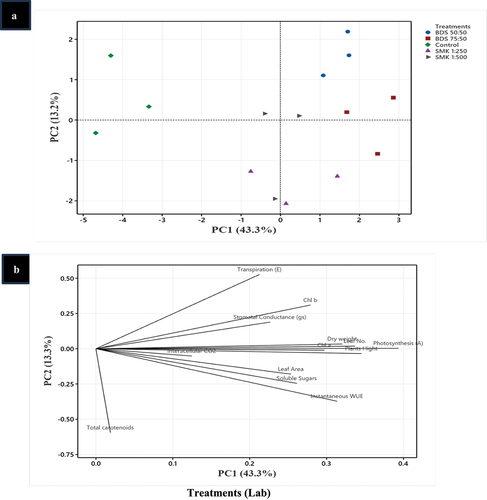
Figure 6. (Continued).
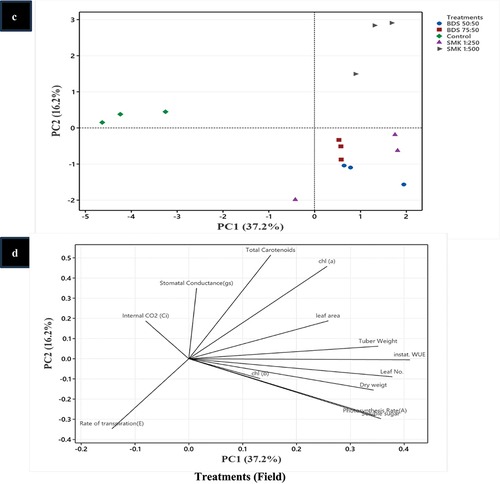
Table 2. Methylation profiling of control and treatments.
Table 3. Comparison of methylation dynamics of control vs treatments.
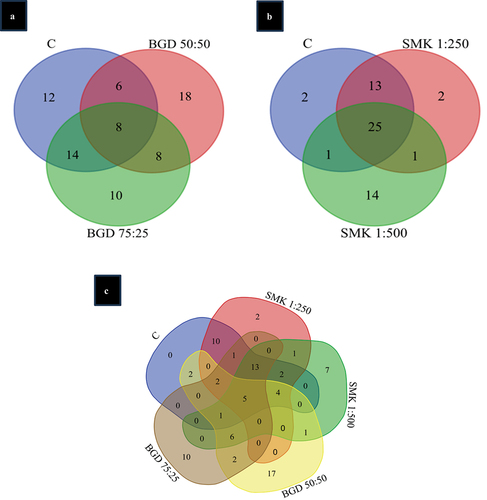
Figure 7. Venn diagram of SMK and BGD treatments. (a) Venn diagram of BGD treatment, (b) venn diagram of smoke treatment, figure 7C: venn diagram of all treatments.