
Figures & data
Table 1. Sequences of primers designed for StXTH genes.
Figure 1. Circular view of the XTH gene density on potato and tomato chromosomes (Chr) under rainfall (a), wind (b) and touch (c) treatments based on the TBtools30.
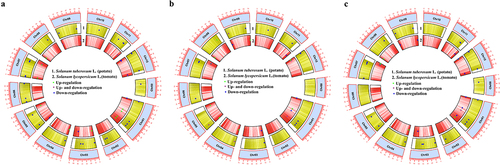
Figure 2. Expression induction and repression of SlXTHs of tomato in rainfall - (R), wind - (W), and touch - (T) treated plants at different time point (0 hour, 15 min, 30 min and 24 hours), assessed by real-time PCR (Average of Log2FC values from three independent samples are presented by bars. Standard deviation is represented by error bars).
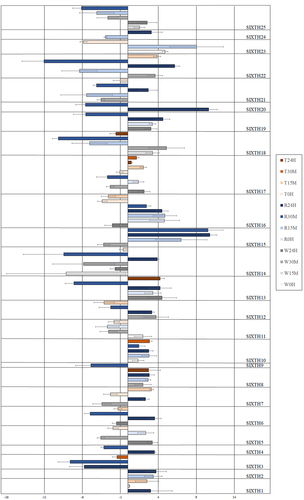
Figure 3. Expression induction and repression of StXTHs of potato in rainfall- (R), wind- (W), and touch- (T) treated plants at different time point (0 hour, 15 min, 30 min and 24 hours), assessed by real-time PCR (Average of Log2FC values from three independent samples are presented by bars. Standard deviation is represented by error bars).
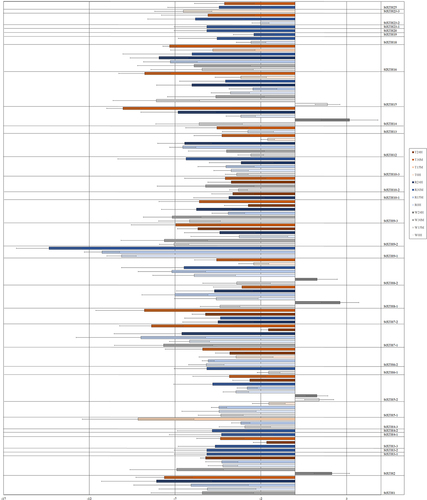
Table 2. Comparative table of mechano-sensitivity of different SlXTHs and StXTHs investigated. Red indicates when the expression level increased, blue indicates when it decreased at any time points. SlXTHs are based on Saladié et al.21, StXTHs are based on Hidvégi et al.Citation20.