
Figures & data
Figure 1. Phylogenetic analysis of the SRO genes in different plants. The accession numbers of the other plant SRO proteins used for evolutionary tree construction are listed in Table S3.
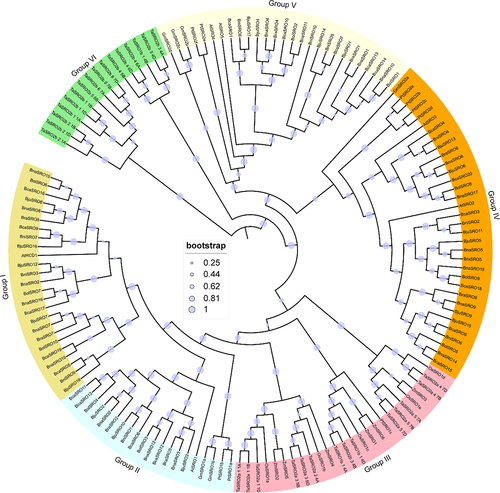
Figure 2. Phylogenetic tree (a), gene structure (b) and conserved motifs (c) of SROs in Brassica. The sequence information of these 15 conserved motifs is shown in Figure S1.
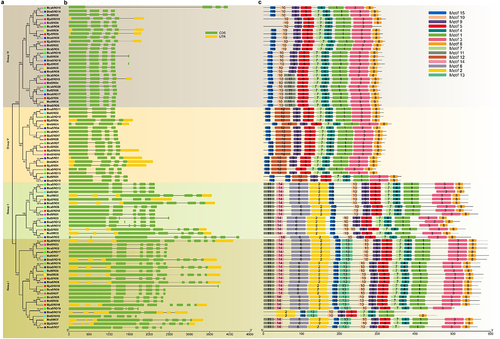
Figure 3. Collinearity of the SRO gene pairs. (a) Collinearity analysis of the SRO gene family in Brassica napus. (b) Collinearity analysis of the SRO gene family in Brassica juncea. (c) collinearity analysis of SRO genes between Brassica napus and Brassica juncea. The identified SRO gene pairs are connected by red lines.
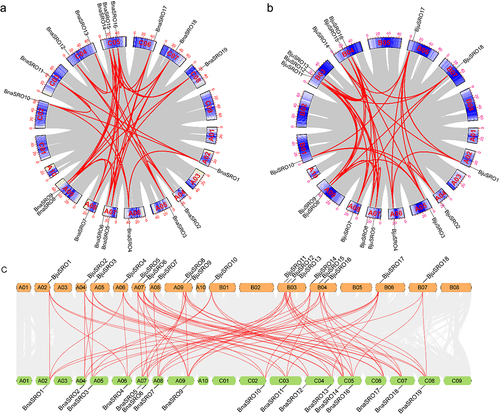
Figure 4. Statistics on the number of cis-acting elements in the promoter region of the BnaSRO genes. The elements were categorized into three groups based on their functions: plant growth and development, phytohormone response, and transcription factor binding or stress response. Heatmaps were drawn based on the number of different elements using TBtools software.
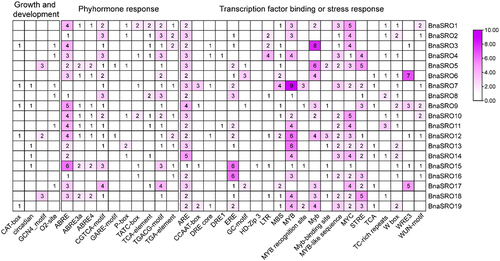
Figure 5. The expression patterns of BnaSROs in rapeseed based on transcriptome data. (a) The expression patterns of BnaSROs in different tissues or developmental periods of rapeseed. (b) The expression patterns of BnaSROs under salt, drought, freezing, cold, heat, and osmotic stresses, as well as under ABA and JA treatments, in rapeseed leaves and roots (c).
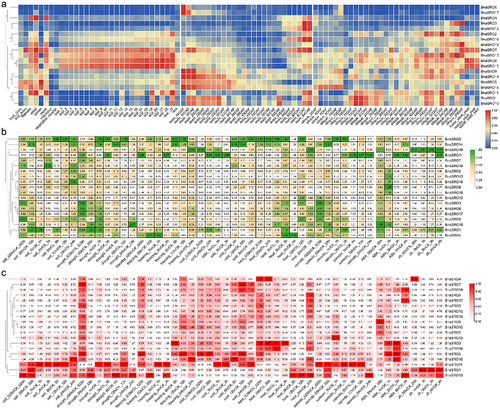
Figure 6. The relative expression levels of the BnaSROs in rapeseed leaves at different time points after exogenous ABA (a) and MeJA (b) treatments. The expression levels were calculated based on the 2−ΔCT method relative to the internal reference gene. The bars represent the mean ± SD (n = 3). The different letters indicate significant differences at p < 0.05 according to Duncan’s test.
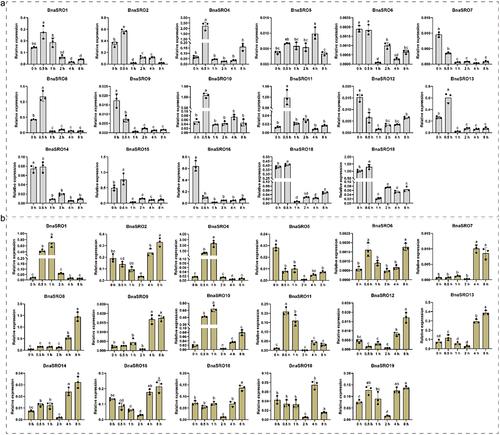
Figure 7. The relative expression levels of BnaSROs in rapeseed leaves after a different number of days of water deficit drought treatment. The expression levels were calculated based on the 2−ΔCT method relative to the internal reference gene. The bars represent the mean ± SD (n = 3). The different letters indicate significant differences at p < 0.05 according to Duncan’s test.
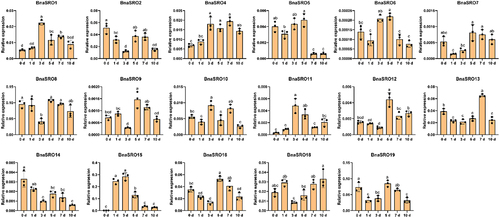
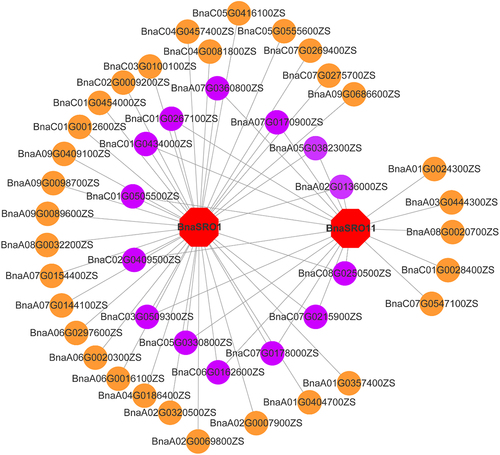
Figure 8. Transcriptional regulatory network of the BnaSRO1 and BnaSRO11 genes. The transcription factor genes are indicated by circles, and those in purple indicate transcription factors that have regulatory relationships with both BnaSRO1 and BnaSRO11. The homologous gene information for these transcription factor genes in Arabidopsis is listed in Table S5.
Supplementary_materials_R.docx
Download MS Word (514.8 KB)Data availability statement
All the data relevant to this study are included in the article or uploaded as Supplementary Materials.