684
Views
2
CrossRef citations to date
0
Altmetric
Regular Articles

Registration of AFM and SEM Scans Using Local Features

Pages 249-270 | Published online: 21 Sep 2011

Figures & data

Figure 1 Example of AFM and SEM image pair, showing FIB-milled structures on a silicon wafer. The left scan shows the AFM topography view. The right scan shows a secondary electron SEM image, covering a larger scanning area than the AFM scan.
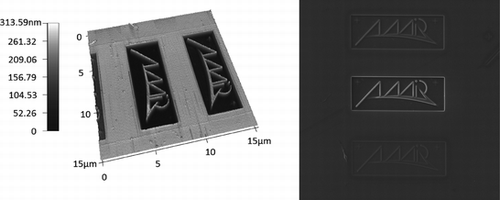
Figure 1 Example of AFM and SEM image pair, showing FIB-milled structures on a silicon wafer. The left scan shows the AFM topography view. The right scan shows a secondary electron SEM image, covering a larger scanning area than the AFM scan.

Figure 2 Overview of proposed registration scheme. Initially, local features are extracted from the SEM and AFM scans. The features are matched against each other and the match is checked for consistency in a refinement step. Based on the feature correspondence, the transformation model parameters are computed. Area-based fine alignment is performed optionally. The final fused view is generated and then displayed.
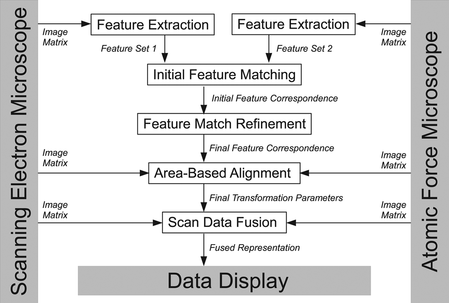
Figure 2 Overview of proposed registration scheme. Initially, local features are extracted from the SEM and AFM scans. The features are matched against each other and the match is checked for consistency in a refinement step. Based on the feature correspondence, the transformation model parameters are computed. Area-based fine alignment is performed optionally. The final fused view is generated and then displayed.

Figure 3 Generation of the SIFT descriptor. Initially, local gradient magnitudes and orientations in the neighborhood of a feature point are weighted with a Gaussian window centered at the feature position. From the result an, orientation histogram (a) is computed, For all orientations with a magnitude of > 80% of the highest peak (indicated by the circle), a descriptor is assigned. Therefore, a grid (b) is placed around the feature point and local gradient magnitudes and orientations with respect to the assigned direction are computed and weighted by a Gaussian window. (c) From the gradients in each sector of the grid, an orientation histogram is computed.
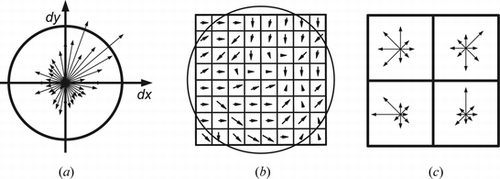
Figure 3 Generation of the SIFT descriptor. Initially, local gradient magnitudes and orientations in the neighborhood of a feature point are weighted with a Gaussian window centered at the feature position. From the result an, orientation histogram (a) is computed, For all orientations with a magnitude of > 80% of the highest peak (indicated by the circle), a descriptor is assigned. Therefore, a grid (b) is placed around the feature point and local gradient magnitudes and orientations with respect to the assigned direction are computed and weighted by a Gaussian window. (c) From the gradients in each sector of the grid, an orientation histogram is computed.

Figure 4 The SURF features descriptor. Wavelet responses for the x any y directions are computed in the neighborhood of a feature point and weighted with a Gaussian window centered at the feature position. The feature orientation is assigned with the help of a sliding window (a). A grid of wavelet responses relative to the assigned feature orientation (b) is then used to compute a descriptor entry. The descriptor entry for each block (c) is built of the sum and the sum of absolute values of the local wavelet responses. Finally, the SURF descriptor is composed out of all block entries.
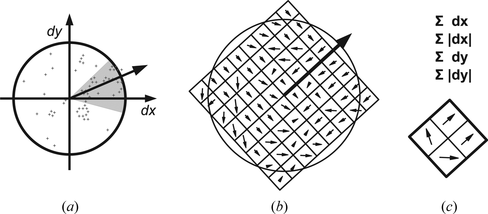
Figure 4 The SURF features descriptor. Wavelet responses for the x any y directions are computed in the neighborhood of a feature point and weighted with a Gaussian window centered at the feature position. The feature orientation is assigned with the help of a sliding window (a). A grid of wavelet responses relative to the assigned feature orientation (b) is then used to compute a descriptor entry. The descriptor entry for each block (c) is built of the sum and the sum of absolute values of the local wavelet responses. Finally, the SURF descriptor is composed out of all block entries.

Figure 5 Successfully matched corresponding regions on the nanocluster sample using the SIFT detector. The circle diameter indicates the scale on which the region has been detected.
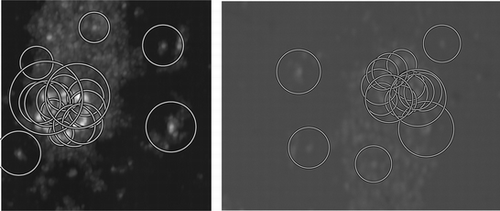
Figure 5 Successfully matched corresponding regions on the nanocluster sample using the SIFT detector. The circle diameter indicates the scale on which the region has been detected.

Figure 6 Overlap error between two regions mapped onto each other as a function of difference in region size (proportional to scale) and location. For overlap errors <50%, region correspondence is assumed.
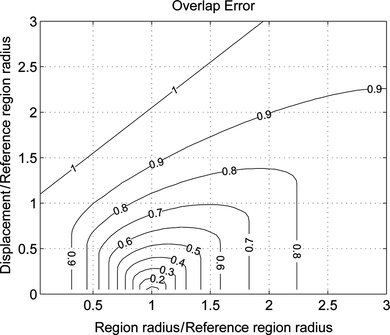
Figure 6 Overlap error between two regions mapped onto each other as a function of difference in region size (proportional to scale) and location. For overlap errors <50%, region correspondence is assumed.

Figure 7 Samples used during experiments, scanned by SEM (upper row) and AFM (lower row): CD surface, DVD surface, FIB-milled pattern, gold nanoclusters, and gold on silicon test pattern (left to right).
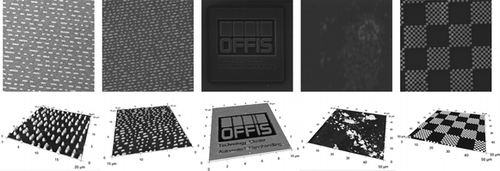
Figure 7 Samples used during experiments, scanned by SEM (upper row) and AFM (lower row): CD surface, DVD surface, FIB-milled pattern, gold nanoclusters, and gold on silicon test pattern (left to right).

Figure 8 Detector performance in terms of repeatability for all samples. A high repeatability means that if a feature is detected in the AFM scan, it is likely to find a corresponding feature in the SEM scan. Feature correspondence is defined by an overlap error <50%. Due to the aspect of multimodality, a lower repeatability is obtained here as compared to monomodal registration (e.g., photograph stitching).
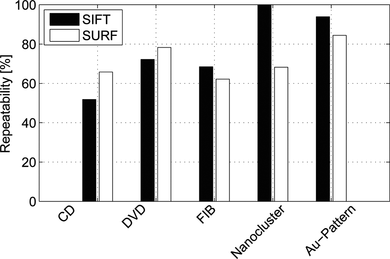
Figure 8 Detector performance in terms of repeatability for all samples. A high repeatability means that if a feature is detected in the AFM scan, it is likely to find a corresponding feature in the SEM scan. Feature correspondence is defined by an overlap error <50%. Due to the aspect of multimodality, a lower repeatability is obtained here as compared to monomodal registration (e.g., photograph stitching).

Figure 9 Feature correspondences between an image pair of the DVD sample set. Only correct matches are displayed. The left image shows the AFM scan, and; the right image shows the SEM scan.
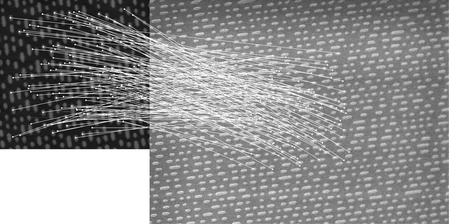
Figure 9 Feature correspondences between an image pair of the DVD sample set. Only correct matches are displayed. The left image shows the AFM scan, and; the right image shows the SEM scan.

Figure 10 Performance of the scale ratio restriction approach, depicted by the recall 1-precision plot for SIFT features computed on the DVD sample. A moderate restriction allowing 25% of deviation from the ground-truth reproduction scale slightly improves the performance in comparison to the unrestricted case (allowing ∞ deviation). By further increasing the restrictions, the performance decreases because correct matches with imprecisely detected scale are then incorrectly rejected.
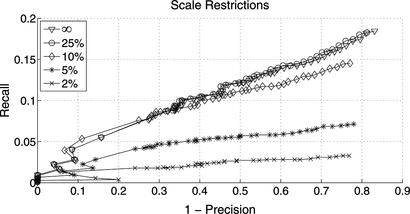
Figure 10 Performance of the scale ratio restriction approach, depicted by the recall 1-precision plot for SIFT features computed on the DVD sample. A moderate restriction allowing 25% of deviation from the ground-truth reproduction scale slightly improves the performance in comparison to the unrestricted case (allowing ∞ deviation). By further increasing the restrictions, the performance decreases because correct matches with imprecisely detected scale are then incorrectly rejected.

Figure 11 Performance of orientation difference restriction approach, depicted by the recall 1-precision plot for SIFT features computed on the DVD sample. Even low restrictions such as a deviation of π/2 from the ground-truth rotation result in a significant gain in performance. For very high restrictions such as a deviation of π/32, the performance falls below the restriction-free case.
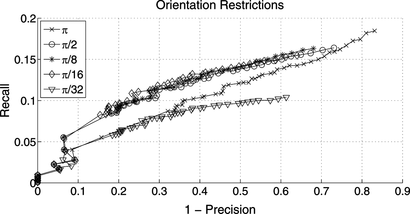
Figure 11 Performance of orientation difference restriction approach, depicted by the recall 1-precision plot for SIFT features computed on the DVD sample. Even low restrictions such as a deviation of π/2 from the ground-truth rotation result in a significant gain in performance. For very high restrictions such as a deviation of π/32, the performance falls below the restriction-free case.

Figure 12 Matching performance for the DVD sample and multiple detector/descriptor combinations, and matching restrictions on scale ratio (S, 25%) and rotation (R, π/16). The SIFT algorithm clearly outperforms the SURF algorithm. The regular-sized SURF descriptor (64) outperforms the extended (128) SURF descriptor.
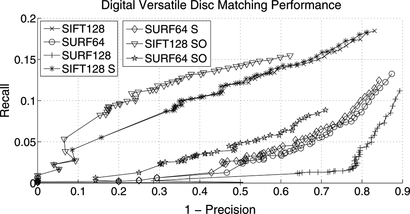
Figure 12 Matching performance for the DVD sample and multiple detector/descriptor combinations, and matching restrictions on scale ratio (S, 25%) and rotation (R, π/16). The SIFT algorithm clearly outperforms the SURF algorithm. The regular-sized SURF descriptor (64) outperforms the extended (128) SURF descriptor.

Figure 13 Matching performance for the CD sample and multiple detector/descriptor combinations, and matching restrictions on scale ratio (S, 25%) and rotation (R, π/16).
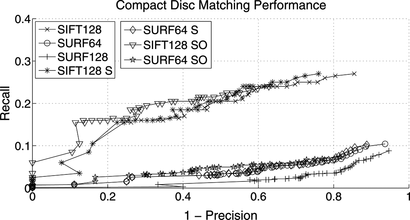
Figure 13 Matching performance for the CD sample and multiple detector/descriptor combinations, and matching restrictions on scale ratio (S, 25%) and rotation (R, π/16).
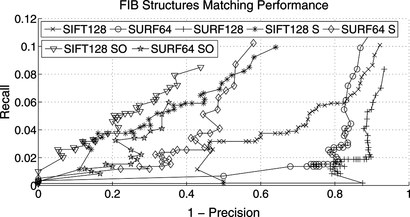
Figure 14 Matching performance for the FIB-milled pattern and multiple detector/descriptor combinations, and matching restrictions on scale ratio (S, 25%) and rotation (R, π/16).
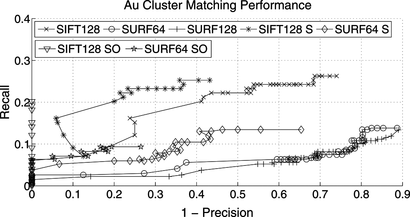
Figure 14 Matching performance for the FIB-milled pattern and multiple detector/descriptor combinations, and matching restrictions on scale ratio (S, 25%) and rotation (R, π/16).

Figure 15 Matching performance for the nanocluster sample and multiple detector/descriptor combinations, and matching restrictions on scale ratio (S, 25%) and rotation (R, π/16).

Figure 15 Matching performance for the nanocluster sample and multiple detector/descriptor combinations, and matching restrictions on scale ratio (S, 25%) and rotation (R, π/16).

Figure 16 Matching performance for the gold on silicon test pattern and multiple detector/descriptor combinations, and matching restrictions on scale ratio (S, 25%) and rotation (R, π/16). Matching restrictions on SURF features bring moderate gains in performance, but have been left out for clarity reasons.
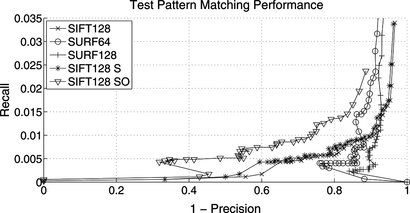
Figure 16 Matching performance for the gold on silicon test pattern and multiple detector/descriptor combinations, and matching restrictions on scale ratio (S, 25%) and rotation (R, π/16). Matching restrictions on SURF features bring moderate gains in performance, but have been left out for clarity reasons.

Table 1. Average computation times of the different setups

Figure 17 Performance results of the area-based registration in terms of e rms . Values for SIFT and SURF show the remaining error after feature-based registration. MI is the error after area-based refinement of the registration.
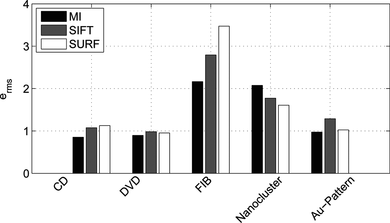
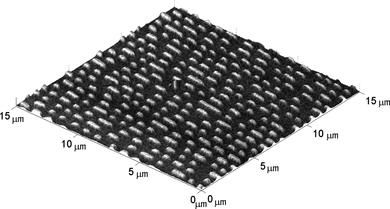
Figure 17 Performance results of the area-based registration in terms of e rms . Values for SIFT and SURF show the remaining error after feature-based registration. MI is the error after area-based refinement of the registration.
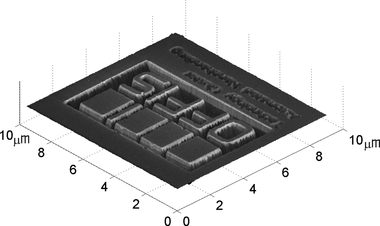
Figure 18 Fusion result for the DVD sample. The AFM scan has been rendered as a three-dimensional surface and is textured by the correctly registered SEM scan.

Figure 18 Fusion result for the DVD sample. The AFM scan has been rendered as a three-dimensional surface and is textured by the correctly registered SEM scan.

Figure 19 Fusion result for the FIB-milled structure. At the edges of the structure which are facing the SEM's electron detector, a high-intensity SE signal is visible.

Figure 19 Fusion result for the FIB-milled structure. At the edges of the structure which are facing the SEM's electron detector, a high-intensity SE signal is visible.

Reprints and Corporate Permissions

Please note: Selecting permissions does not provide access to the full text of the article, please see our help page How do I view content?

To request a reprint or corporate permissions for this article, please click on the relevant link below:

Academic Permissions

Please note: Selecting permissions does not provide access to the full text of the article, please see our help page How do I view content?

Obtain permissions instantly via Rightslink by clicking on the button below:

If you are unable to obtain permissions via Rightslink, please complete and submit this Permissions form. For more information, please visit our Permissions help page.