Figures & data
Figure 1. Schematic explaining the principle of the trapping of nanoparticles by periodically localized light generated on a subwavelength grating of period D < λ, where the wavelength of the incident light is λ.
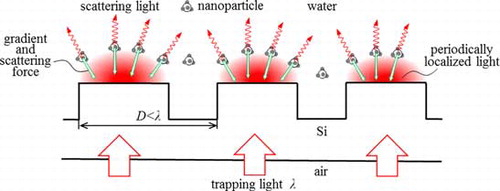
Figure 2. Ellipsometric scheme for detecting nanoparticles trapped on a subwavelength grating.
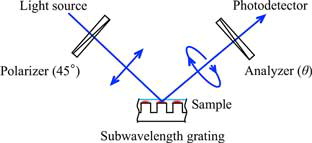
Figure 3. Optical setup of the trapping and detection system.
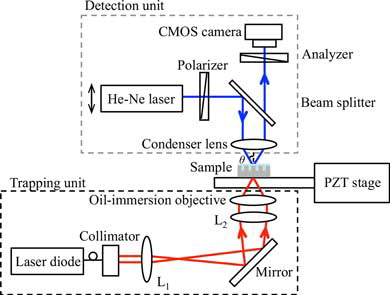
Figure 4. Simulated relative light intensity distribution for subwavelength gratings. Panel (a) presents the FDTD model. Panels (b) to (g) are the results for the region inside the dotted square in panel (a) for the indicated duty ratios d.
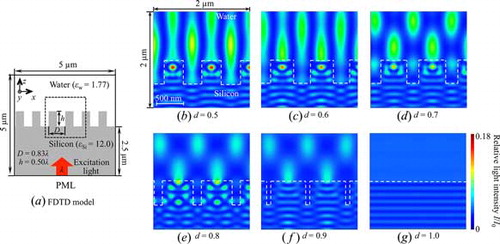
Figure 5. Plot of the light intensity just above the grating as a function of distance along the x axis for various duty ratios d. The intensities are normalized relative to that of the incident light.
Figure 6. The phase difference Δ and the amplitude ratio Ψ as a function of the rotation angle α of the subwavelength grating without any sample on it. When α = 90°, the grooves are perpendicular to the incident plane.
Figure 7. Ellipsometric measurements of nanoparticles trapped on gratings having d = 0.650, 0.675, and 0.700. Panel (a) plots Ψ measured as a function of the incident light power P. Panel (b) graphs Δ measured as a function of P.