Figures & data
Figure 1. Experimental setup for the characterization of optical WGM resonators and the stimulated Brillouin scattering. PC: fiber polarization controller. OC: optical circulator. L1, L2: fiber lenses. VOA: variable optical attenuator. FC (50:50): 3 dB directional fiber coupler. OSA: optical spectrum analyzer. PD1, PD2: InGaAs photodetector. Inset: picture of the BaF2 disk coupled by a SF11 prism.
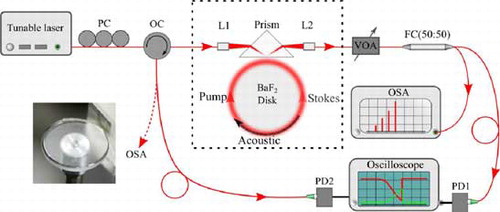
Figure 2. Transmission spectra of the resonator-prism coupling setup by PD1. (a) The pump laser is swept across WGM resonances over 1.6 GHz spectral range within 5 ms. (b) A zoom in of a WGM resonance featuring a ring down phenomenon due to ultrahigh Q factors. A theoretical fit gives an intrinsic linewidth of 1.0 × 10⁹.
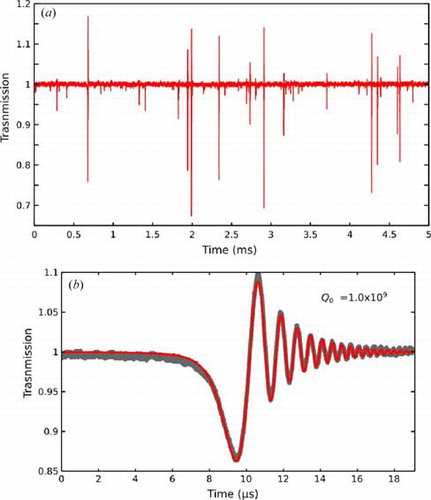
Figure 3. Simultaneous recording of the transmitted pump and the reflected signals. Upper curve: the transmission of the pump in PD1. Lower curve: the reflected signal in PD2. (a) The action of SBS is observed with an absorbed pump threshold of 4.5 mW. (b) An increased coupling gap reduces the coupling efficiency but decreases the absorbed pump threshold for SBS lasing. Inset: the corresponding optical spectrum in the backward direction.
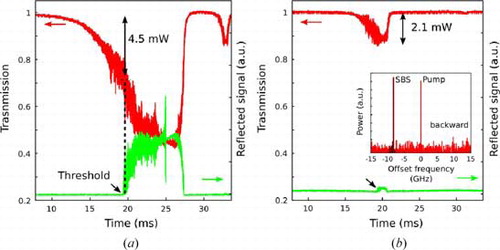
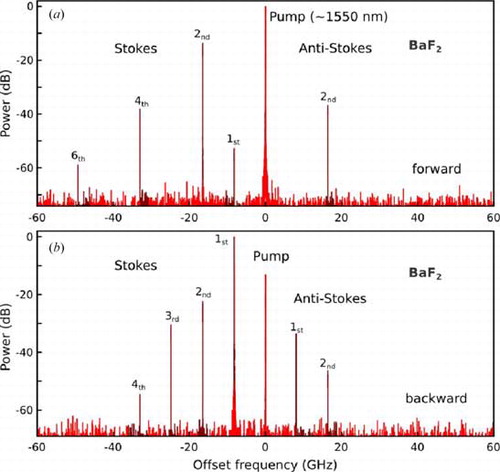
Figure 4. Cascaded Brillouin scattering in a BaF2 disk resonator pumped at 1550 nm. (a) In the forward direction. (b) In the backward direction. The observation of the anti-Stokes could be due to the four-wave mixing process, when considering the fact that the double SBS frequency shift could coincide with the triple FSR of the resonator.