Figures & data
Figure 1. HS-PAS setup for (a) ocular measurement with eye and OAC standard and (b) validation.
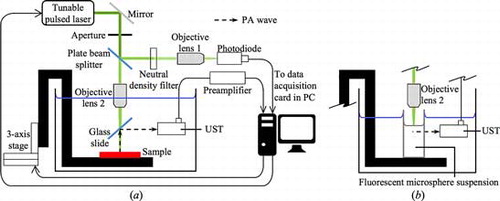
Figure 2. (a) UST and (b) photodiode signals of OAC standard under 500 nm excitation.
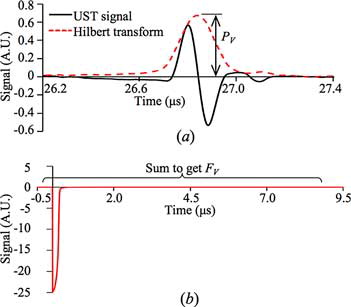
Figure 3. (a) PV(λ) and (b) FV(λ) of the OAC standard and sample.
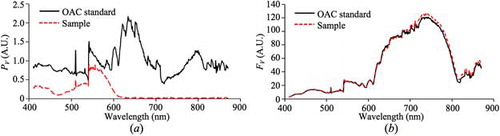
Figure 4. (a) Assumed behavior of light in OAC standard. Experimental setup to measure (b) transmittance, and (c) reflectance of OAC standard.
Figure 5. Normalized OAC spectrum of standard μstd_N(λ).
Figure 6. μsam_N(λ) of Red fluorescent microsphere suspension.
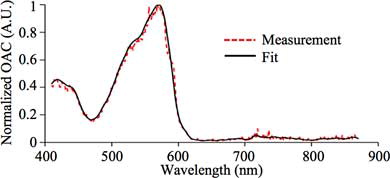
Figure 7. Validation results using (a) Red, (b) Crimson and (c) Nile Red fluorescent microsphere suspensions.
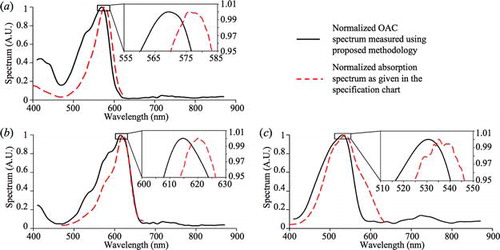
Figure 8. Measured normalized OAC spectrum of iris in porcine eye sample.
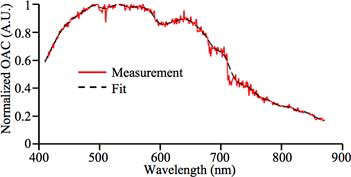
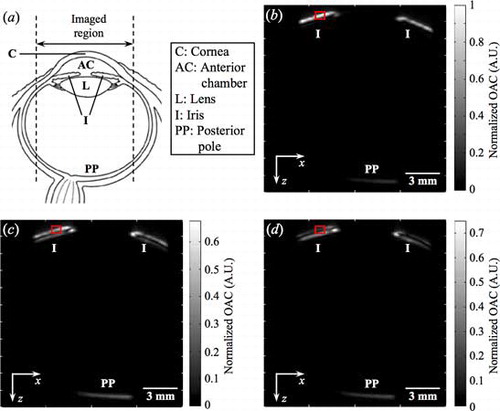
Figure 9. (a) Schematic of the eye. B-scan images across the center of the eye using (b) 465 (c) 750, and (d) 870 nm.