
Figures & data
Figure 1. Normalized light distribution curve and light trace diagram of traditional mini-LEDs and WA mini-LEDs.
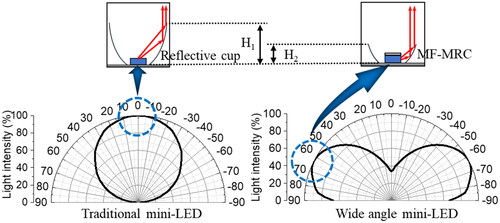
Figure 2. Light intensity distribution of mini-LEDs at different beam angles.
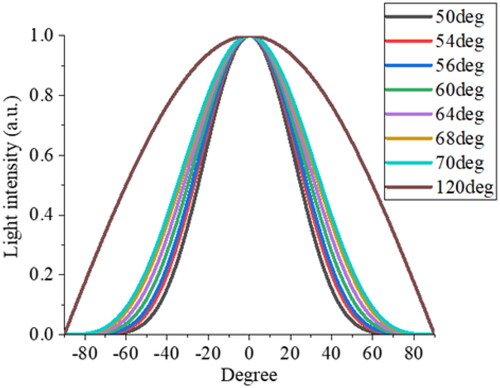
Figure 3. Illuminance distribution of mini-LEDs at a FWHM of (a) 50°, (b) 54°, (c) 56°, (d) 58°, (e) 60°, (f) 68°, (g) 70°, and (h) 120°.
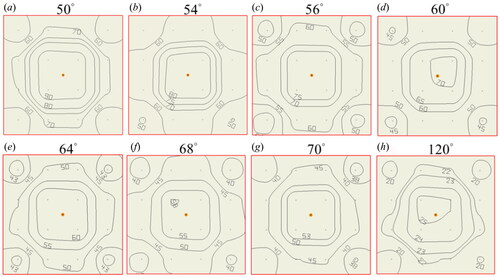
Table 1. Illuminance and uniformity of mini-LEDs with different FWHMs.
Figure 4. Illustrate the design concept of WA mini-LEDs combined with MF-MRC. (a) Schematic diagram of the multi-focus reflective cavity, (b) schematic diagram of WA mini-LEDs combined with MF-MRC, (c) normalized light distribution curve of WA mini-LEDs combined with different height reflective cavities.
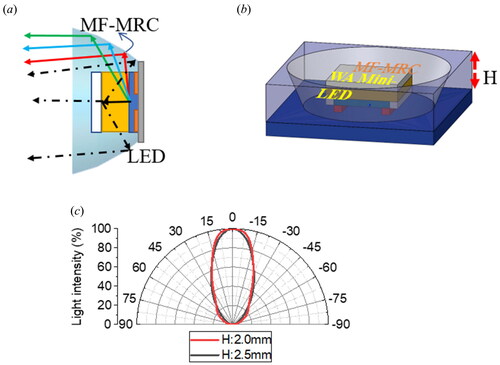
Figure 5. Illustrates the differences between traditional mini-LEDs and WA mini-LEDs. (a) 2D ray tracing, (b) 3D polar distribution, and (c) Irradiance plot.
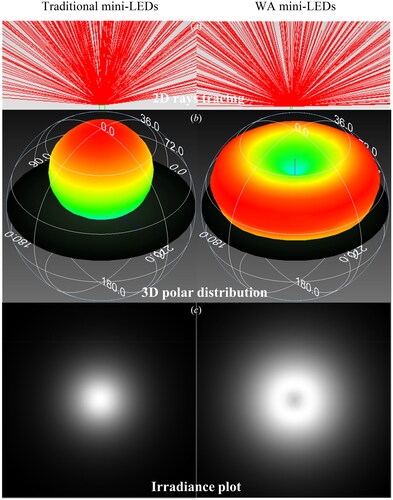
Figure 6. Manufacturing process of WA mini-LEDs combined with thin multi-focal micro-reflector cavity.
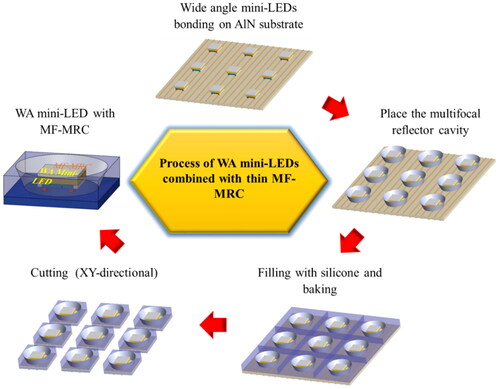
Figure 7. Image of the actual sample with a reflective cavity height of (a) 2 mm and (b) 2.5 mm; (c) normalized light distribution curve of WA mini-LEDs combined with actual samples with different reflective cavity heights; (d) schematic diagram of five-point uniformity measurement.
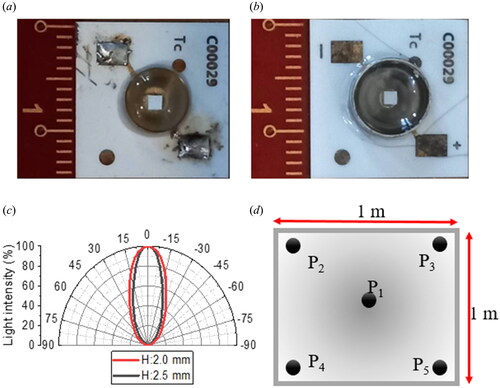
Table 2. Comparison of the uniformity of different designs of flashlight modules.
Data availability statement
The data presented in this study are available on request from the all authors.