Figures & data
Figure 1. (a) Optical principle of multichannel detection using a mixed-mode fibre cantilever: (a) cladding detection mode, (b) multimode core detection mode.
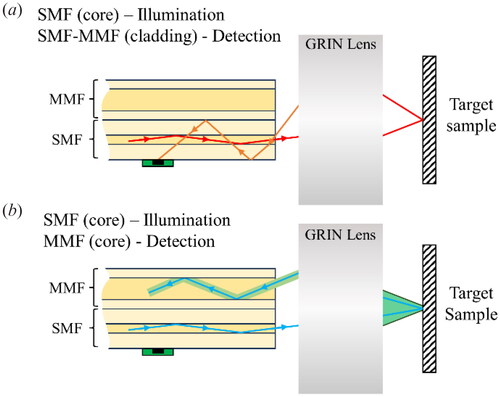
Figure 2. (a) Top and (b) front schematic view of the mixed-mode, dual-core fibre cantilever-based endoscopic scanner, along with its respective (c) top and (d) front photograph of the scanner. (e) Schematic of the overall scanning system.
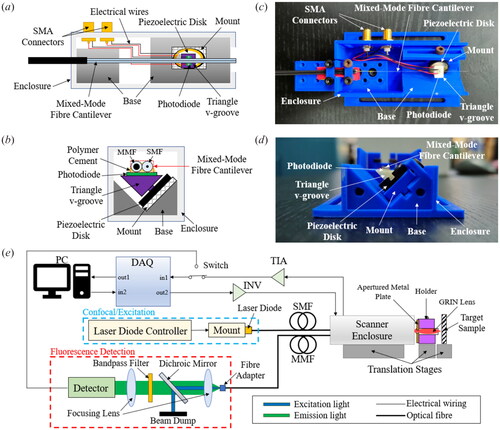
Figure 3. (a) Intensity curve of 1% w/v fluorescent microspheres solution under 405 nm excitation. The inset shows the photographs of the microsphere solution under daylight and UV (365 nm) irradiation respectively. (b) Photoluminescent excitation and emission spectra of the CDs used. The inset figure shows the CDs solution’s appearance under daylight and UV irradiation respectively. (c) Photoluminescent intensity of CDs and CD-PVA films kept for 30 minutes under constant UV (365 nm) irradiation. (d) Controlled PVA film and CD-PVA film under daylight and UV irradiation, respectively.
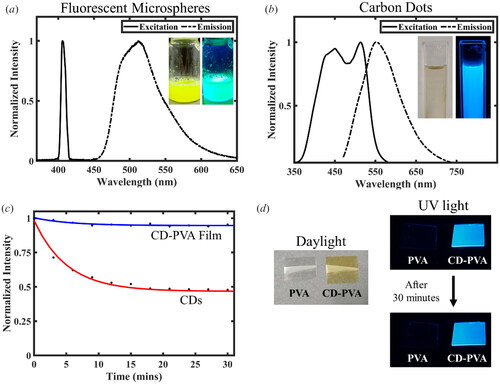
Figure 4. (a) Lens cleaning tissues with microspheres (left) and CDs (right) under daylight and UV irradiation respectively. (b) Controlled (left) and CDs-fed (right) vigna radiata plants under white light and UV light.
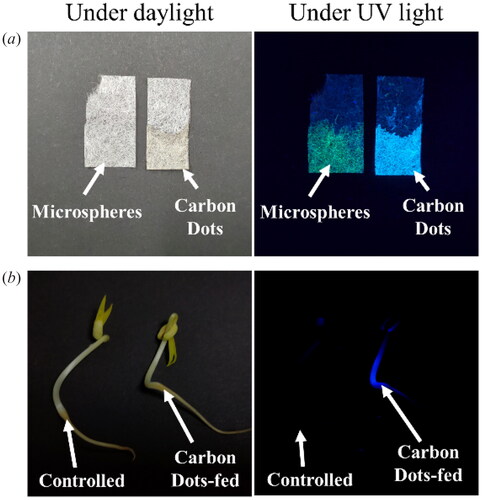
Figure 5. Linear (a) x-axis and (b) y-axis scanning lines showing clear lines without mechanical cross-coupling from both fibre cores. The SMF and MMF core were coupled with 405 nm and 635 nm laser respectively. (c) Clear Lissajous scan from both fibre cores. (d) Measured frequency response curve of the mixed-mode fibre cantilever. fhigh= 596.5 Hz (x-axis) and flow = 282.0 Hz (y-axis).
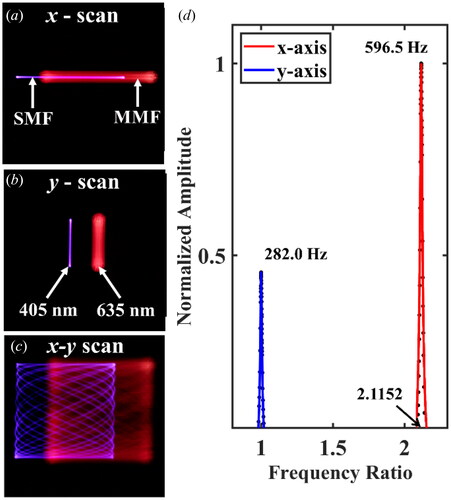
Figure 6. USAF 1951 Resolution Test Target, Group 6 and 7: (a) Microscope reference and (b) reconstructed image from the mixed-mode fibre cantilever-based endoscopic scanner. (c) Beam profile at the focal plane with Gaussian fitting. The Inset figure shows the microscope image of the beam spot at the focal plane. (d) Intensity profile at the tip of microspheres with Gaussian fitting. The lateral and axial resolution based on the FWHM are 5.81 and 6.52 µm, respectively.
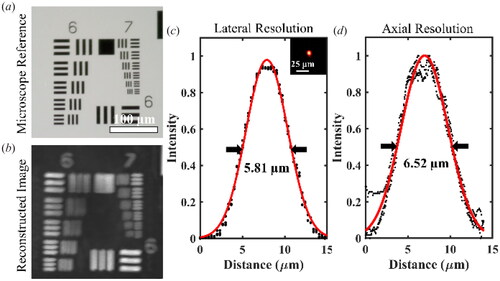
Figure 7. Microscope image of fluorescent microspheres under (a) daylight and (b) UV irradiation. (c) Fluorescence image results of the microspheres. Microscope image of PVA and CD-PVA films under (d) daylight and (e) UV irradiation, with (f) corresponding fluorescence image result.
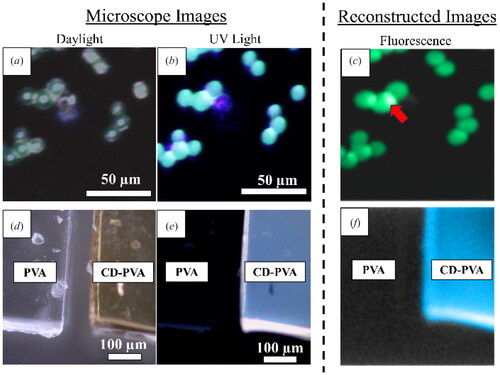
Figure 8. Multimodal imaging on lens-cleaning tissues with fluorescent microspheres. Microscopy images of the fibrous network with microspheres under (a) daylight and (b) UV light. The clusters of microspheres were indicated within the dotted circle and individual microspheres were indicated with arrows. (c) Microscopic cross-sectional view of the sample. Reconstructed images using (d) reflectance confocal imaging and (e) fluorescence imaging (pseudo-coloured), along with the (f) overlay image showing the location of the microspheres.
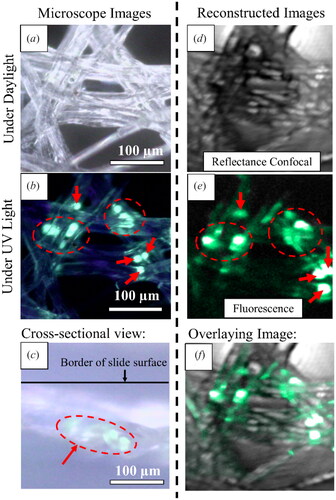
Figure 9. Multimodal imaging on lens-cleaning tissues partially soaked with CDs. Microscope images of the fibrous network sample under (a) daylight and (b) UV light. The corresponding (c) confocal reflectance and (d) fluorescence image of the sample with (e) their overlaying image.
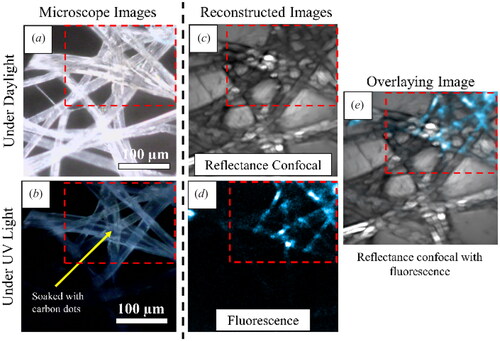
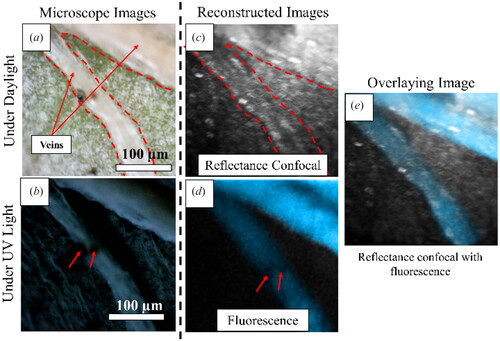
Figure 10. Microscope image of a mung bean leaf under (a) daylight and (b) UV light. Reconstructed images of the respective leaf using (c) reflectance confocal imaging and (d) fluorescence imaging. (e) Overlay image from reflectance confocal image and fluorescence.