Figures & data
Table 1. Sub-parts per round of the PCT.
Figure 1. A top view of the course of the PCT including the sub-parts.
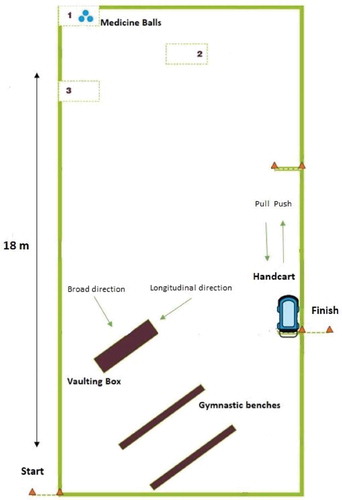
Figure 2. Female participant in sportswear (t-shirt, short pants, and athletic footwear) and police uniform (strengthened pants, armored shoes, safety vest and a belt with handcuffs). The loaded bluegun and pepper spray, which participants also wore in their belt during testing, are not displayed in this figure.
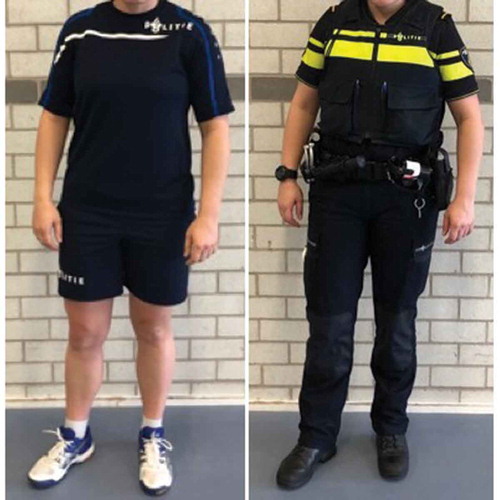
Table 2. Average times when wearing sportswear and police uniform (SDs in parentheses).
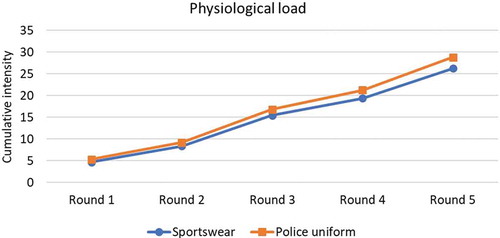
Table 3. RPE scores, average physiological intensity (% of subjects’ HRmax and converted to a 0–10 scale) and cumulative physiological load (accumulated sum of the physiological intensity values) comparing sportswear and police uniform (SDs in parentheses).
Figure 3. Average physiological intensity per round defined as % of subjects’ HRmax and converted to a 0–10 scale.
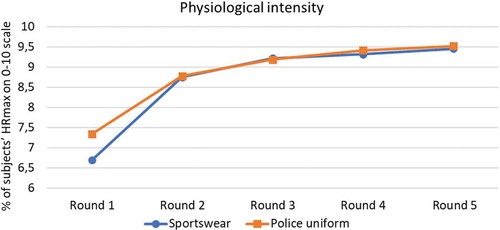
Figure 4. Cumulative physiological load per round. This figure illustrates the physiological load defined as an accumulated sum of the physiological intensity values.